Fig. 3.
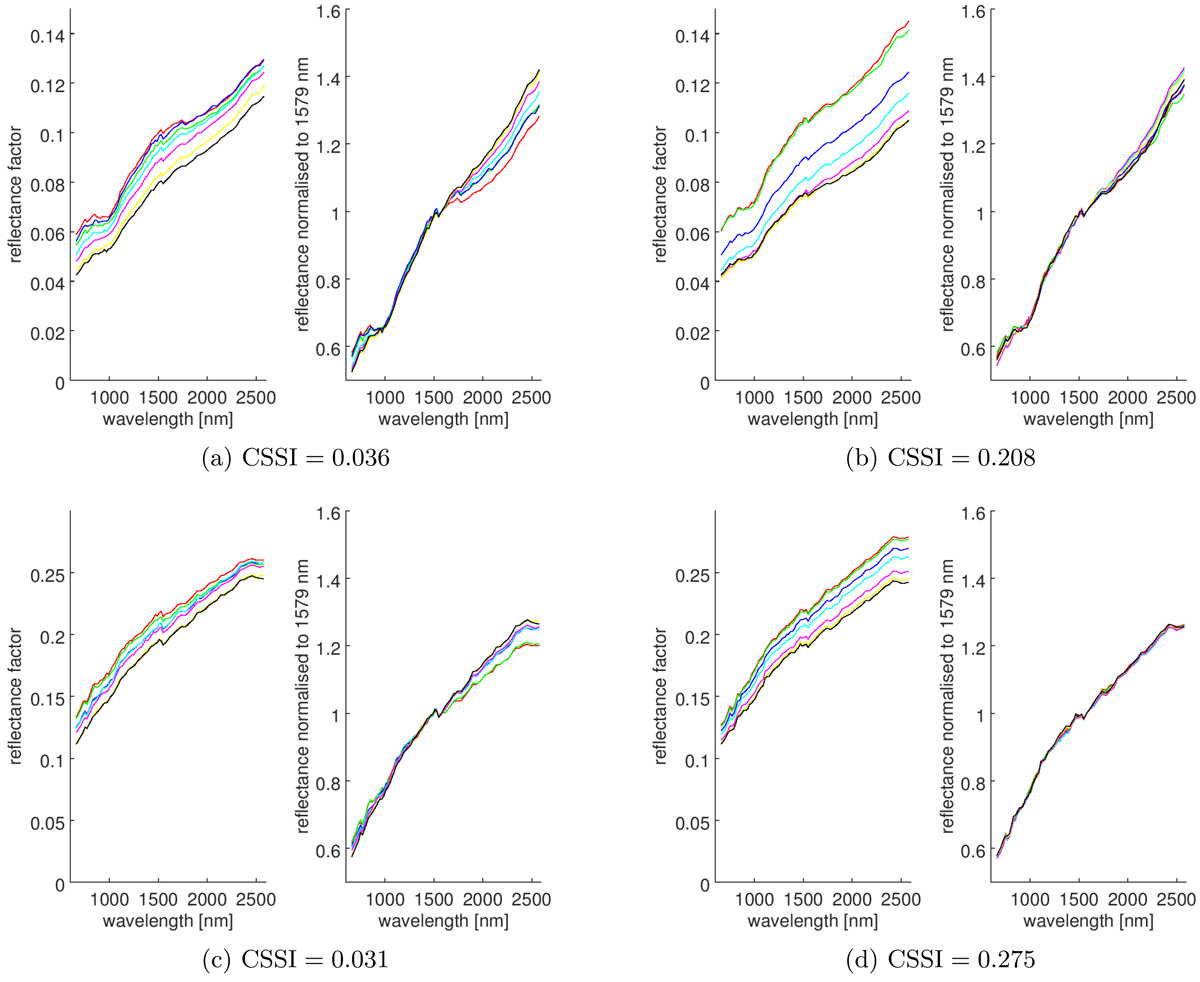
Measured spectral trends from on-swirl to off-swirl locations for spectral pairs representing a spectral trend consistent with reduced space-weathering and increased soil compaction, respectively. Panels a, b: mare swirl Reiner Gamma. Panels c, d: highland swirl near Dufay. The footprint size of the spectra is 700 × 700 m. Each series of spectra was extracted at seven equidistant points on the straight line connecting the on-swirl location with the corresponding off-swirl location. The spectra which are brightest and darkest at 1.579 μm, respectively, were used to compute the compaction-significance spectral index (see Sect. 2). The wavelength range is 0.661 μm to 2.577 μm.
Current usage metrics show cumulative count of Article Views (full-text article views including HTML views, PDF and ePub downloads, according to the available data) and Abstracts Views on Vision4Press platform.
Data correspond to usage on the plateform after 2015. The current usage metrics is available 48-96 hours after online publication and is updated daily on week days.
Initial download of the metrics may take a while.