Fig. 2.
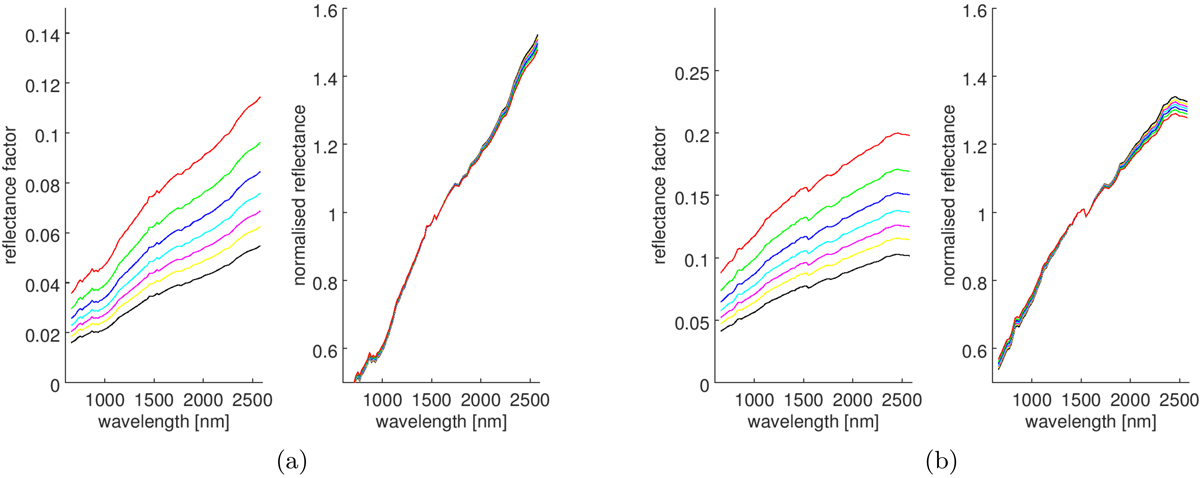
Spectral trend due to soil compaction computed based on the model by Hapke (2008). The darkest line in each plot corresponds to the measured spectrum. The brighter spectra are modeled based on the filling factor of the model by Hapke (2008) with increasing soil compaction. Panel a: mature mare spectrum (average of 1 km2 area at 14.167° E, 21.700° N). Panel b: mature highland spectrum (average of 1 km2 area at 182.400° E, 2.233° N). The filling factor ranges from 0 (bottom curve) to 0.6 (top curve) in steps of 0.1.
Current usage metrics show cumulative count of Article Views (full-text article views including HTML views, PDF and ePub downloads, according to the available data) and Abstracts Views on Vision4Press platform.
Data correspond to usage on the plateform after 2015. The current usage metrics is available 48-96 hours after online publication and is updated daily on week days.
Initial download of the metrics may take a while.