Fig. A.4.
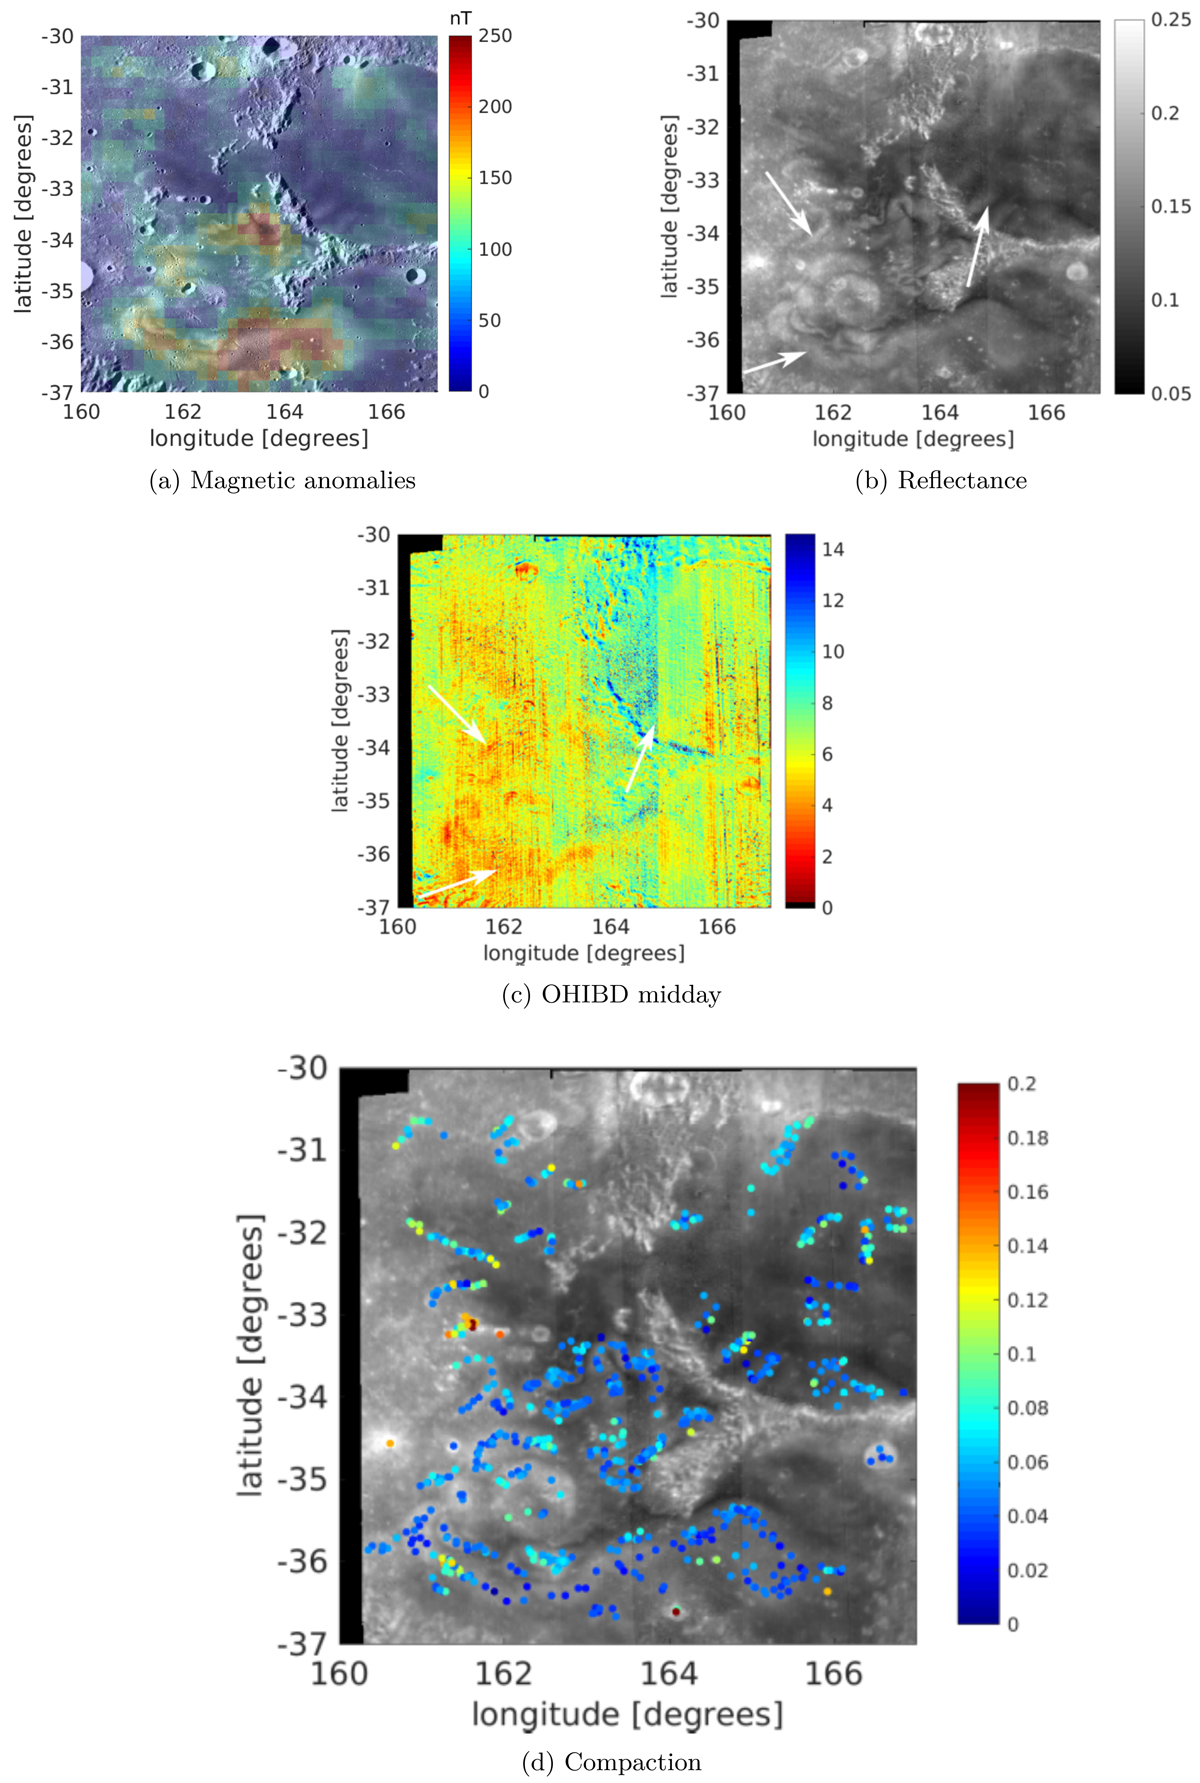
Swirl in Mare Ingenii. White arrows indicate swirl structures, black pixels denote missing data. Panel a: LROC WAC mosaic (Wagner et al. 2015) with Kaguya magnetic flux density maps at surface level (Tsunakawa et al. 2015) as overlay. Panel b: M3 reflectance at 1.579 μm. Panel c: 3 μm band depth. Panel d: CSSI, overlaid on M3 reflectance at 1.579 μm.
Current usage metrics show cumulative count of Article Views (full-text article views including HTML views, PDF and ePub downloads, according to the available data) and Abstracts Views on Vision4Press platform.
Data correspond to usage on the plateform after 2015. The current usage metrics is available 48-96 hours after online publication and is updated daily on week days.
Initial download of the metrics may take a while.