Free Access
Fig. 8.
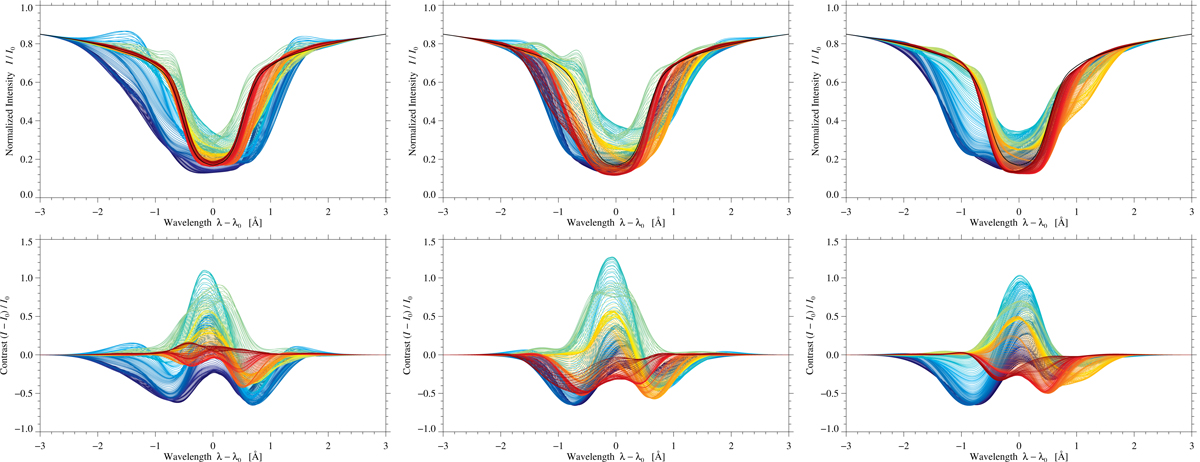
Hα intensity (top) and contrast (bottom) along the green cross section in Fig. 5, which starts at the blue and ends at the red square (see online movie with an animated sequence of profiles). Blue and red also indicate the start and end of the color table for the profiles at 09:05 UT, 09:14 UT, and 09:23 UT (left to right).
Current usage metrics show cumulative count of Article Views (full-text article views including HTML views, PDF and ePub downloads, according to the available data) and Abstracts Views on Vision4Press platform.
Data correspond to usage on the plateform after 2015. The current usage metrics is available 48-96 hours after online publication and is updated daily on week days.
Initial download of the metrics may take a while.