Fig. 7.
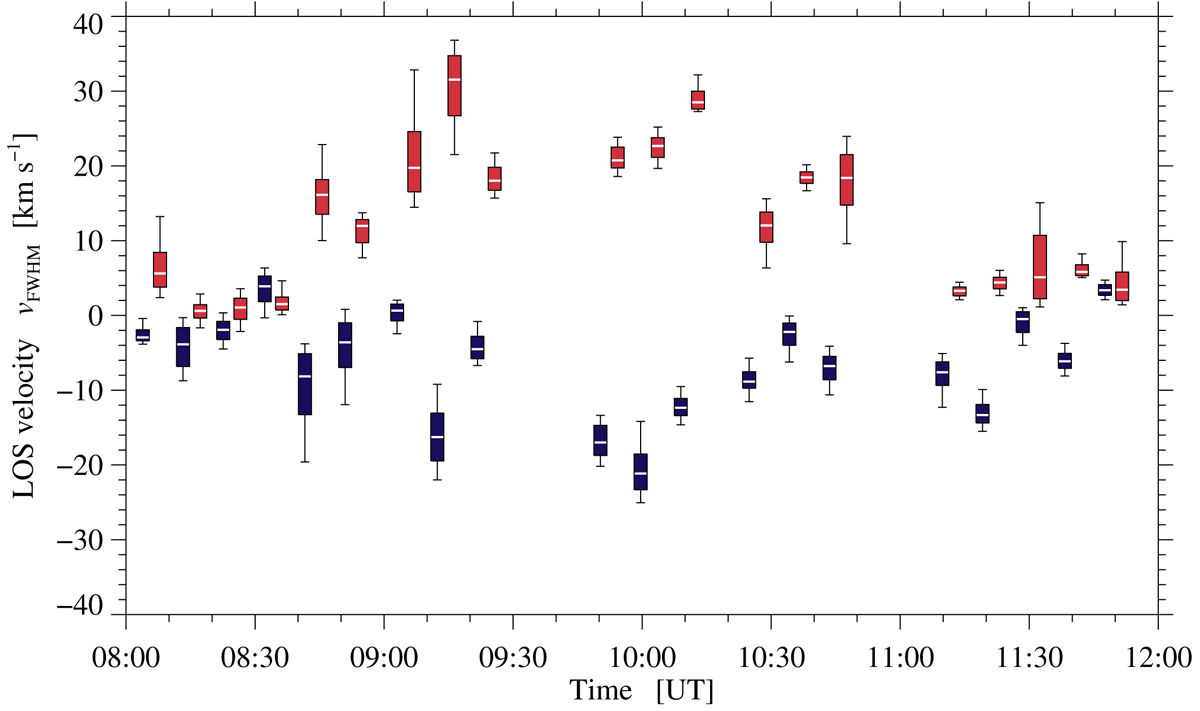
Box and whisker plot of the FWHM velocities at the locations that are indicated in Fig. 5 by colored plus signs (+) and crosses (×). The box extends over one standard deviation above and below the mean velocity of a 10 × 10 pixel region. The upper and lower whisker refer to the maximum and minimum velocity in that region, respectively. Blue and red refer to the location of persistent up- and downflows, respectively. The white horizontal line inside the boxes corresponds to the median velocity.
Current usage metrics show cumulative count of Article Views (full-text article views including HTML views, PDF and ePub downloads, according to the available data) and Abstracts Views on Vision4Press platform.
Data correspond to usage on the plateform after 2015. The current usage metrics is available 48-96 hours after online publication and is updated daily on week days.
Initial download of the metrics may take a while.