Fig. 6.
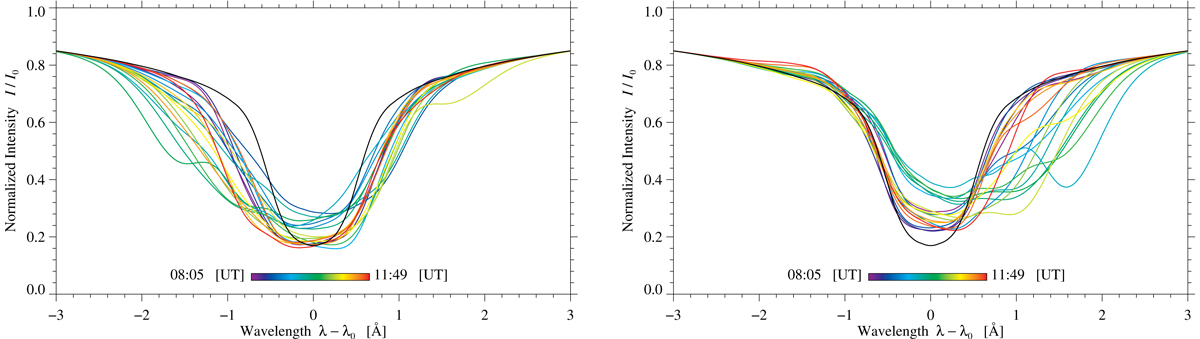
Hα profiles after PCA decomposition for two regions with persistent upflows (left) and downflows (right) in excess of ±3 km s−1 (see online movie with an animated sequence of profiles). The locations are indicated in Fig. 4 by colored plus signs (+) and crosses (×). The color bar at the bottom uses the same color scheme to track the temporal evolution of the spectral line profiles. The black line corresponds to the quiet-Sun profile in both panels.
Current usage metrics show cumulative count of Article Views (full-text article views including HTML views, PDF and ePub downloads, according to the available data) and Abstracts Views on Vision4Press platform.
Data correspond to usage on the plateform after 2015. The current usage metrics is available 48-96 hours after online publication and is updated daily on week days.
Initial download of the metrics may take a while.