Fig. 5.
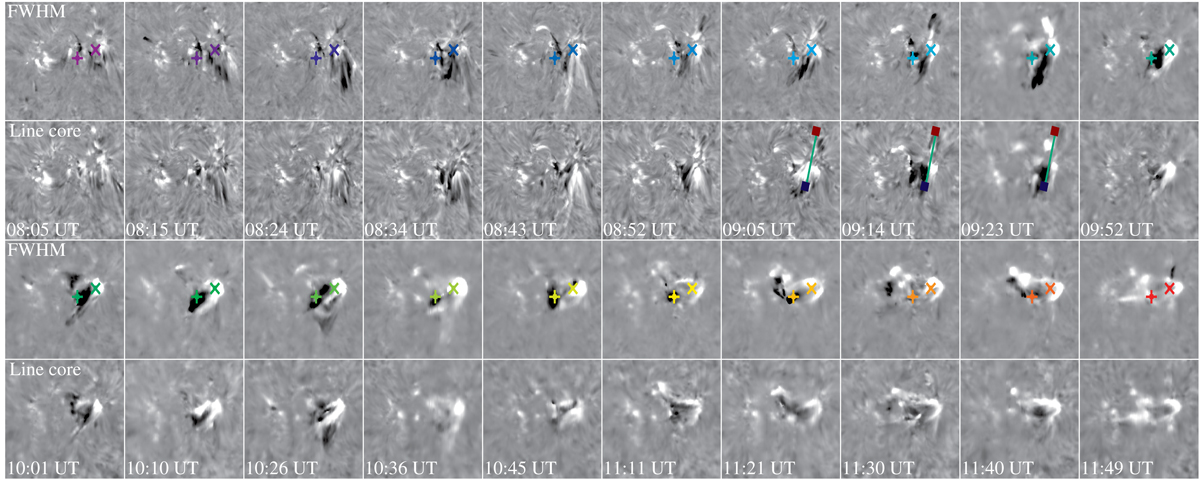
Slit-reconstructed FWHM (rows 1 and 3) and line-core (rows 2 and 4) velocity maps. The maps are scaled between ±10 km s−1. Black and white corresponds to upflows and downflows, respectively. The colored plus signs (+) and crosses (×) are persistent blue- and redshifted regions recognized by using the average of 20 velocity maps with LOS velocities of ±3 km s−1. The corresponding Hα profiles are shown in Fig. 6. The intensity and contrast profiles along the green lines in panels 7 – 9 are displayed in Fig. 8. The accompanying online movie provides a visualization of the temporal changes of these two parameters.
Current usage metrics show cumulative count of Article Views (full-text article views including HTML views, PDF and ePub downloads, according to the available data) and Abstracts Views on Vision4Press platform.
Data correspond to usage on the plateform after 2015. The current usage metrics is available 48-96 hours after online publication and is updated daily on week days.
Initial download of the metrics may take a while.