Fig. 4.
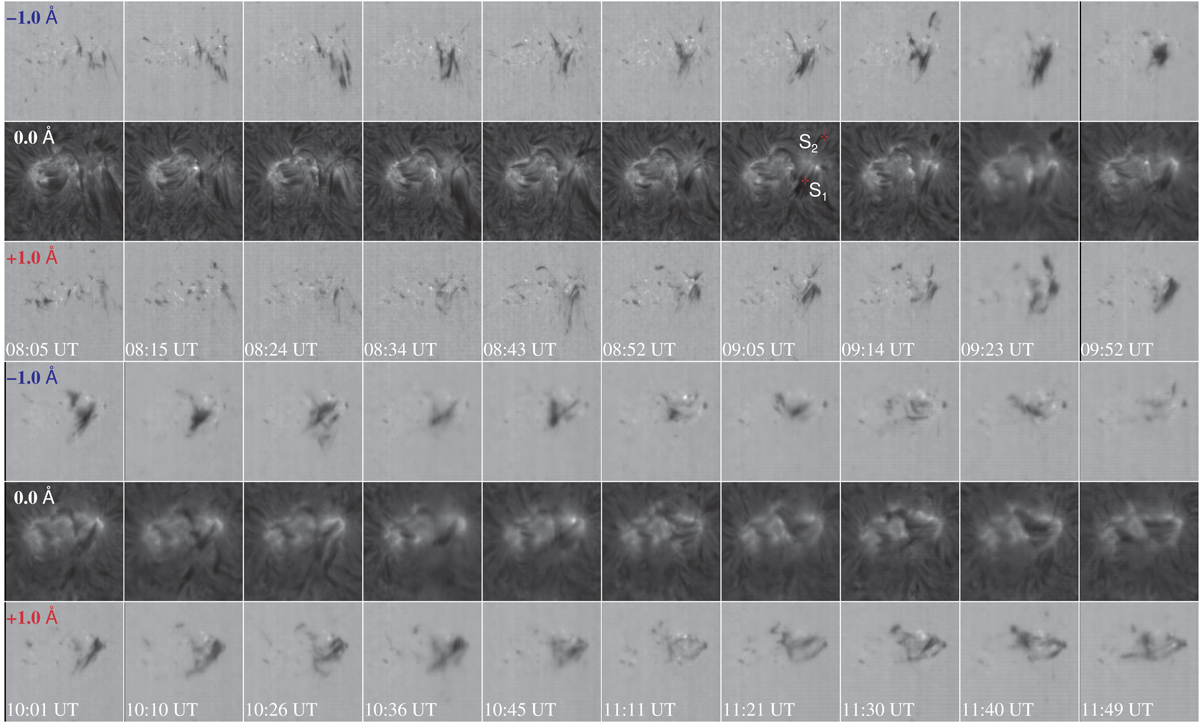
Slit-reconstructed Hα line-core intensity maps (rows 2 and 5) for all 20 scans, along with the corresponding maps of the blue (rows 1 and 4) and red (rows 3 and 6) line-wing intensity at ±1.0 Å observed on 11 September 2018. The image contrast of the line-core, and blue and red line-wing intensity maps are in the ranges 0.15–0.80, 0.25–1.4, and 0.25–1.4 I/I0, respectively. All maps depict the region of interest of 100″ × 100″shown in the top panels of Fig. 2. Two locations along the surge are indicated in panel seven of row 2 as S1 and S2, which are discussed in Sect. 3.6 and depicted in Fig. 10. The accompanying online movie furnishes a detailed view of ongoing dynamics in the active region.
Current usage metrics show cumulative count of Article Views (full-text article views including HTML views, PDF and ePub downloads, according to the available data) and Abstracts Views on Vision4Press platform.
Data correspond to usage on the plateform after 2015. The current usage metrics is available 48-96 hours after online publication and is updated daily on week days.
Initial download of the metrics may take a while.