Fig. 2.
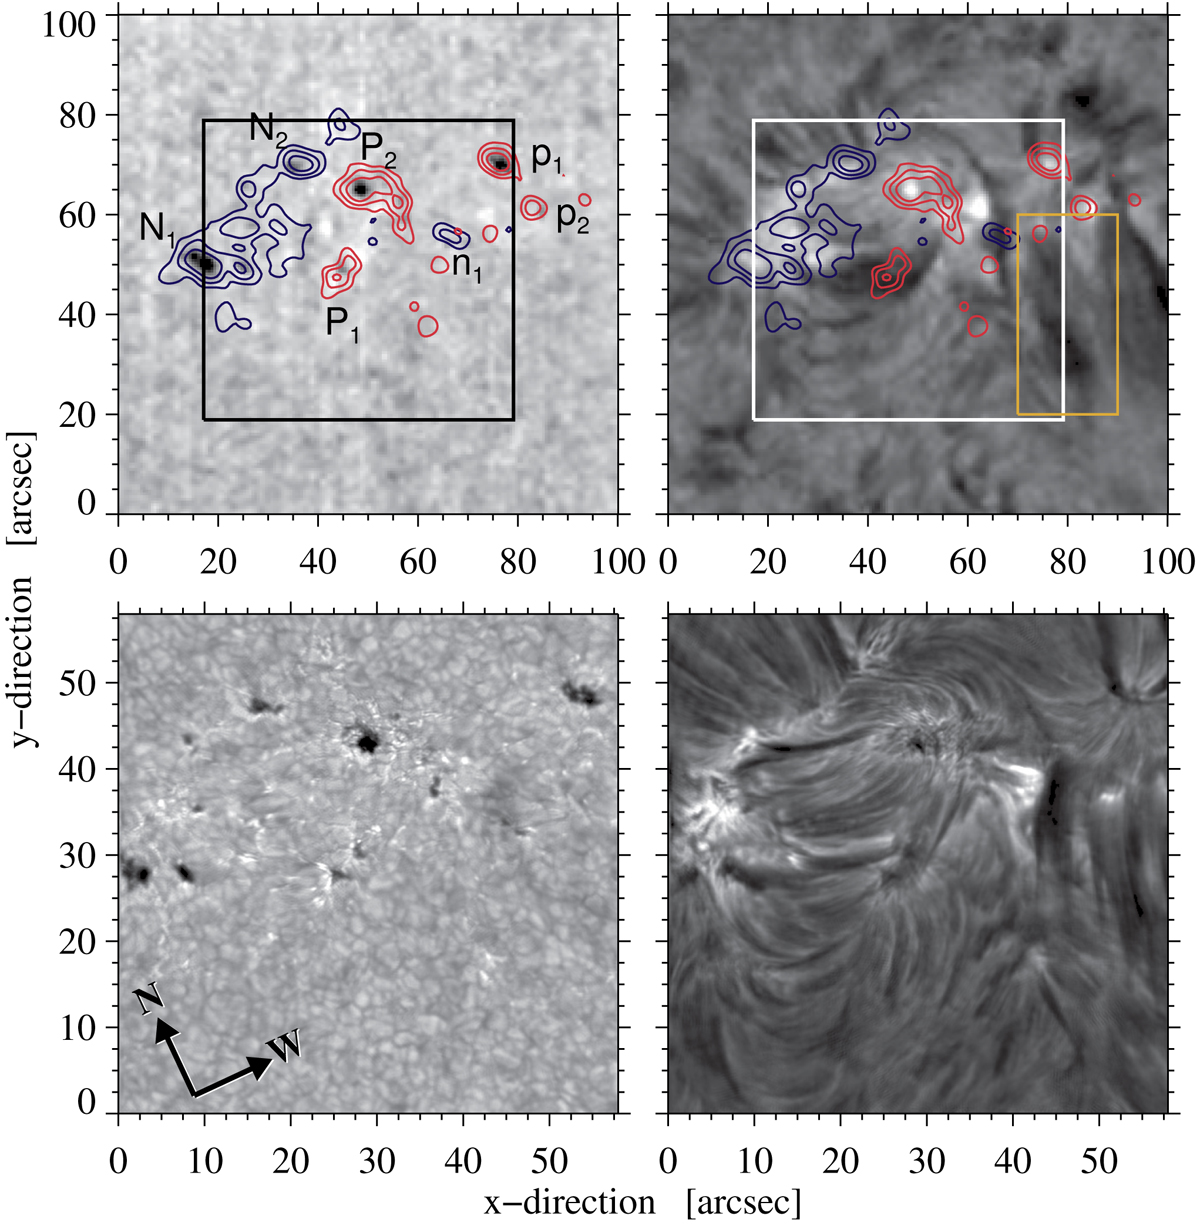
Slit-reconstructed Hα continuum (top left) and line-core (top right) intensity images of active region NOAA 12722 observed at 08:05 UT on 11 September 2018. The blue and red contours refer to a co-temporal magnetogram at ±100, ±250, and ±500 G. The black and white squares give the location of restored Hα broadband (bottom left) and narrowband line-core (bottom right) filtergrams taken at 07:50 UT. The yellow rectangle (top right) gives the location of continuous surge activity.
Current usage metrics show cumulative count of Article Views (full-text article views including HTML views, PDF and ePub downloads, according to the available data) and Abstracts Views on Vision4Press platform.
Data correspond to usage on the plateform after 2015. The current usage metrics is available 48-96 hours after online publication and is updated daily on week days.
Initial download of the metrics may take a while.