Free Access
Fig. 10.
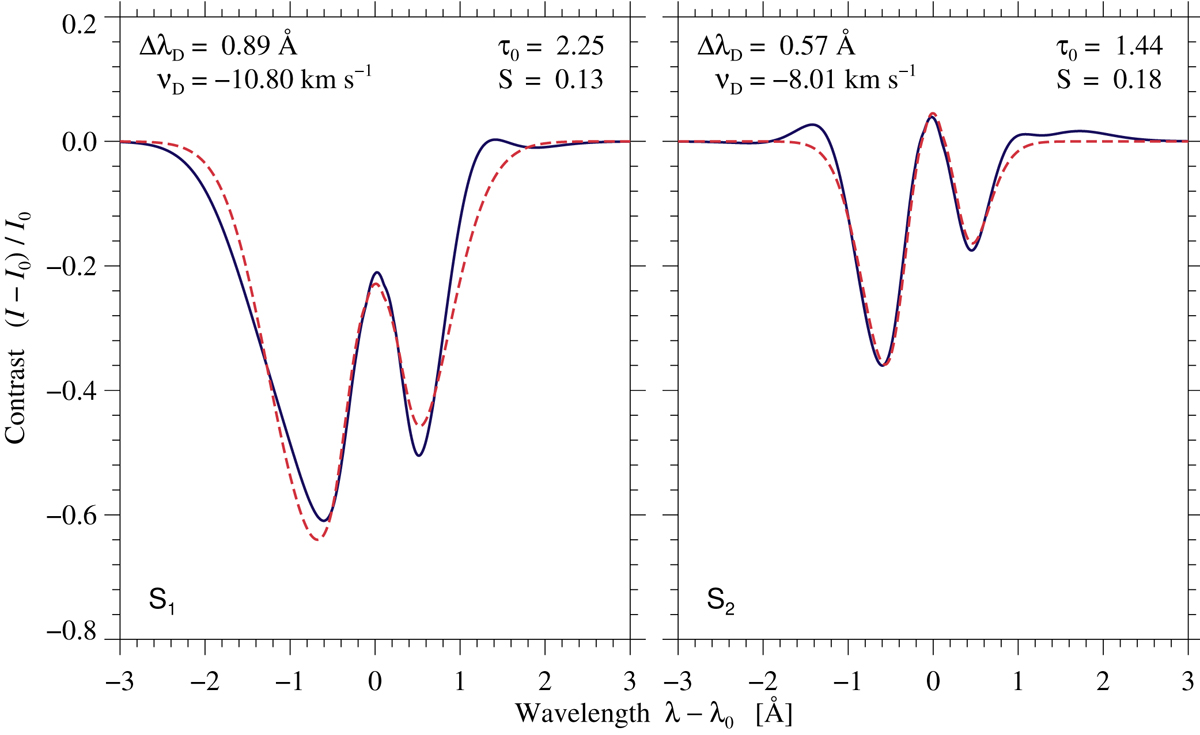
PCA decomposed (solid blue) and CM (dashed red) Hα contrast profiles for two locations S1 (left) and S2 (right) within the surge (see Fig. 4). The CM parameters are given at the top of the panels.
Current usage metrics show cumulative count of Article Views (full-text article views including HTML views, PDF and ePub downloads, according to the available data) and Abstracts Views on Vision4Press platform.
Data correspond to usage on the plateform after 2015. The current usage metrics is available 48-96 hours after online publication and is updated daily on week days.
Initial download of the metrics may take a while.