Fig. 1.
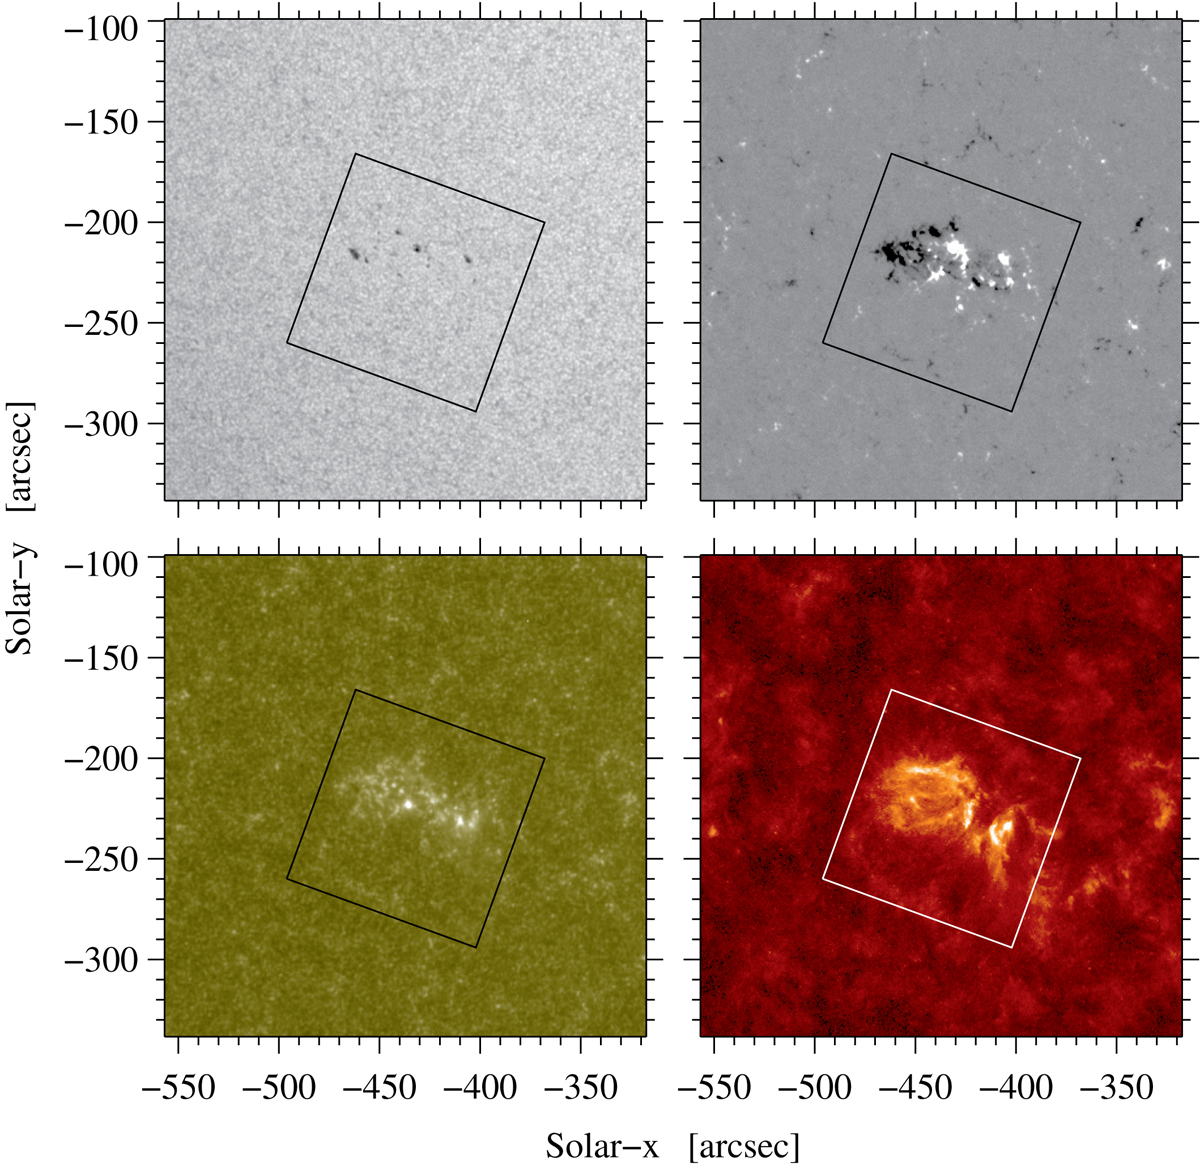
Overview of active region NOAA 12722: HMI continuum image (top left), HMI magnetogram (top right), AIA UV λ1600 Å image (bottom left), and AIA EUV He IIλ304 Å image (bottom right) observed at 08:05 UT on 11 September 2018. The magnetogram was clipped between ±250 G. The black and white boxes represent the central 100″ × 100″ of the FOV scanned by the VTT echelle spectrograph (see online movie with a one-minute cadence for a detailed view).
Current usage metrics show cumulative count of Article Views (full-text article views including HTML views, PDF and ePub downloads, according to the available data) and Abstracts Views on Vision4Press platform.
Data correspond to usage on the plateform after 2015. The current usage metrics is available 48-96 hours after online publication and is updated daily on week days.
Initial download of the metrics may take a while.