Fig. 4.
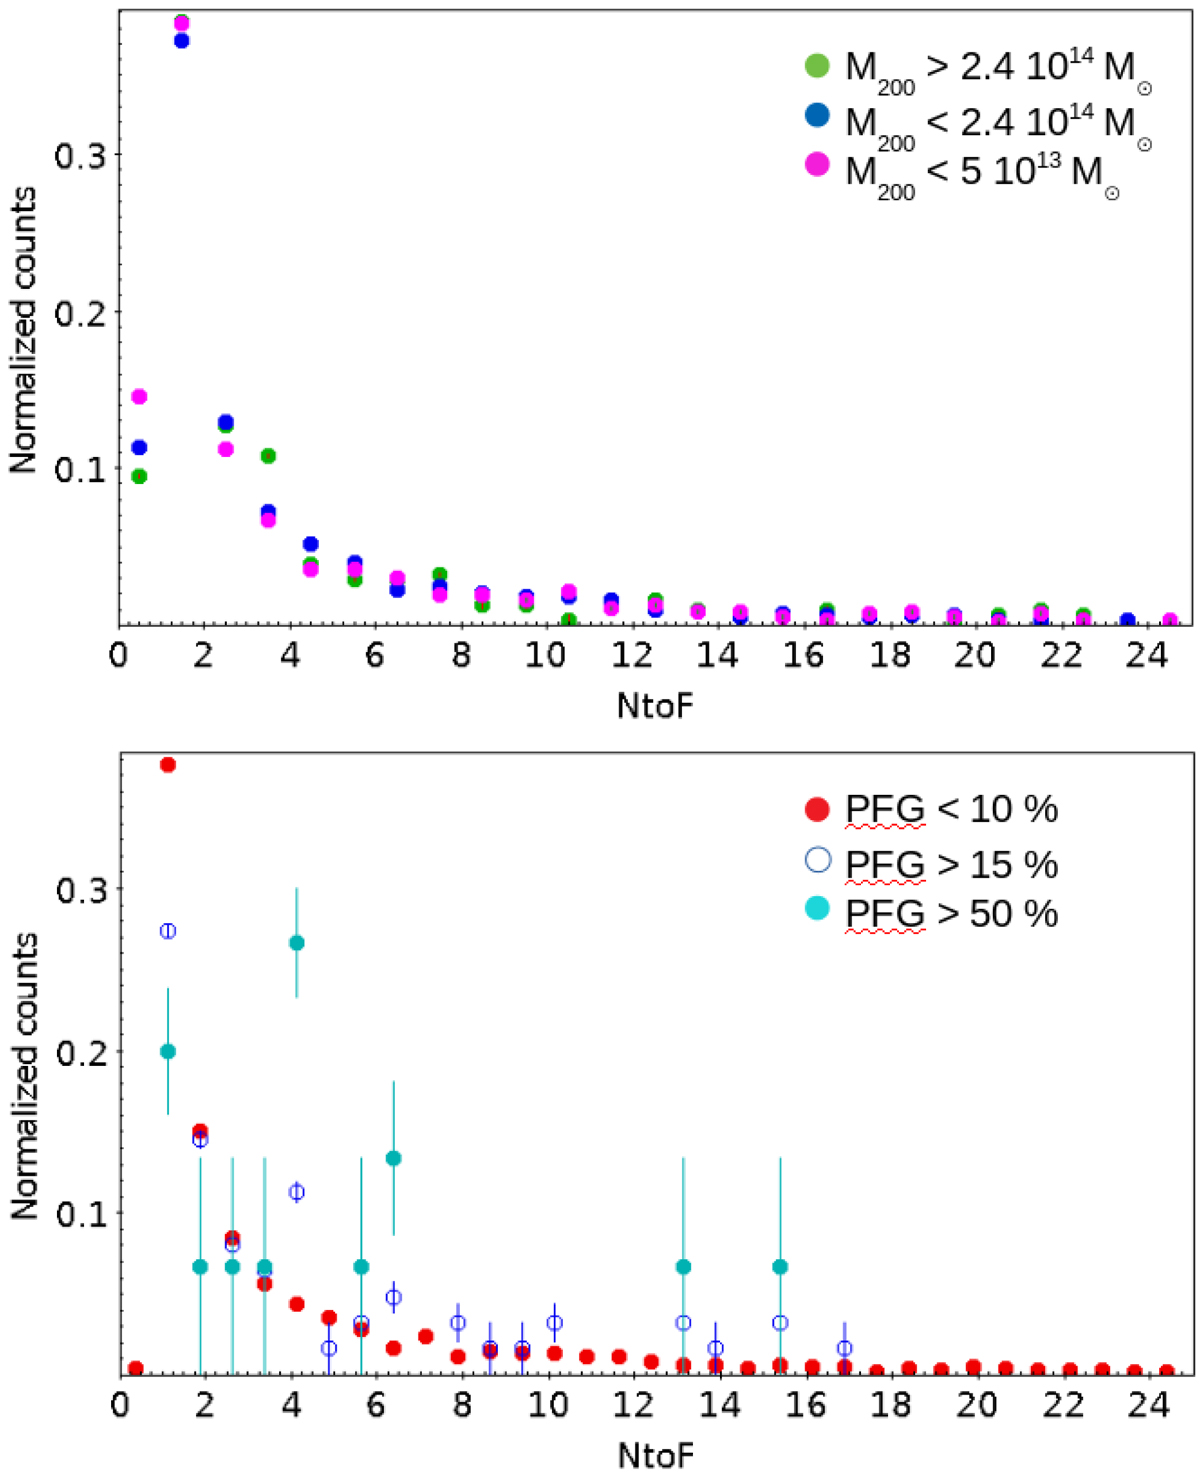
Upper panel: arbitrarily normalized counts of the ratios NtoF between the distance to the nearest node and to the nearest filament for different structure masses. Structures more massive than 2.4 × 10¹⁴ M⊙ are shown in green, and structures less massive than 2.4 × 10¹⁴ M⊙ are plotted in blue. Structures less massive than 5 × 10¹³ M⊙ are shown in magenta. Lower panel: arbitrarily normalized counts of the ratios NtoF between the distance to the nearest node and to the nearest filament for different PFG values. A PFG lower than 10% is plotted with filled red symbols, a PFG higher than 15% with open blue symbols, and a PFG higher than 50% with filled cyan symbols. Error bars are Poissonian and smaller than the point size in the upper panel.
Current usage metrics show cumulative count of Article Views (full-text article views including HTML views, PDF and ePub downloads, according to the available data) and Abstracts Views on Vision4Press platform.
Data correspond to usage on the plateform after 2015. The current usage metrics is available 48-96 hours after online publication and is updated daily on week days.
Initial download of the metrics may take a while.