Fig. 1.
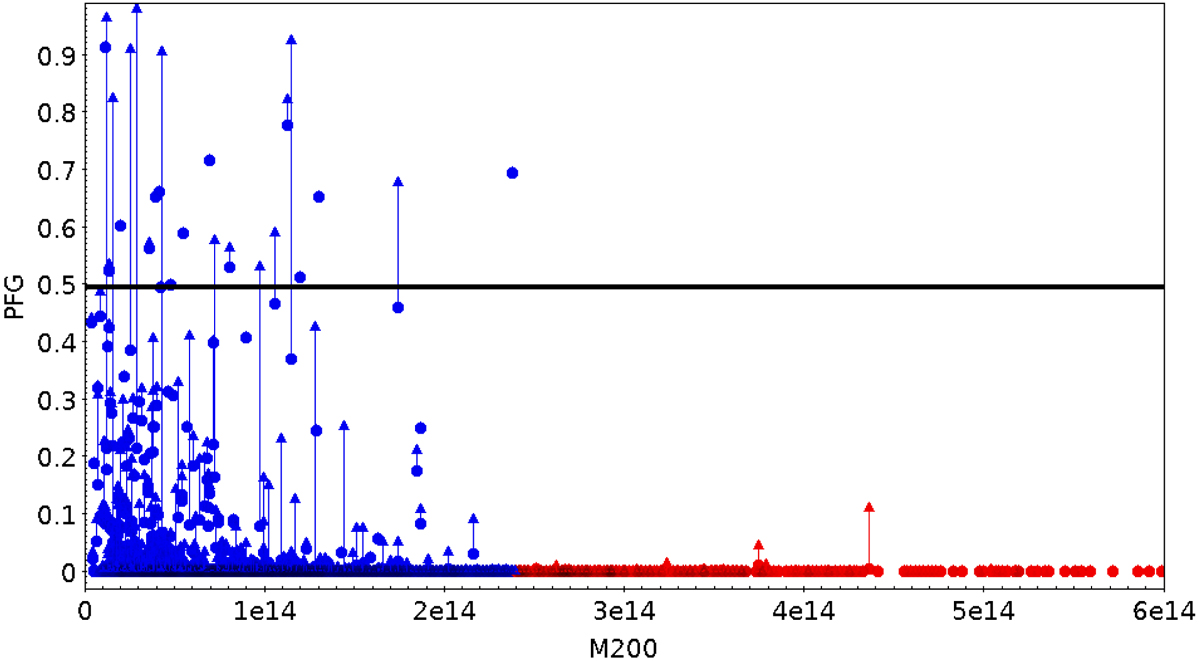
PFG probability for the structures to be FGs as a function of their estimated M200 (Sarron et al. 2018). The vertical blue arrows show the PFG increase when a 20% ICL additional contribution to the BCG (or BGG) magnitude is allowed. Blue dots are galaxy structures less massive than 2.4×10¹⁴ M⊙, and red dots are more massive than 2.4×10¹⁴ M⊙. The horizontal black line shows the 50% level for PFG.
Current usage metrics show cumulative count of Article Views (full-text article views including HTML views, PDF and ePub downloads, according to the available data) and Abstracts Views on Vision4Press platform.
Data correspond to usage on the plateform after 2015. The current usage metrics is available 48-96 hours after online publication and is updated daily on week days.
Initial download of the metrics may take a while.