Fig. 8.
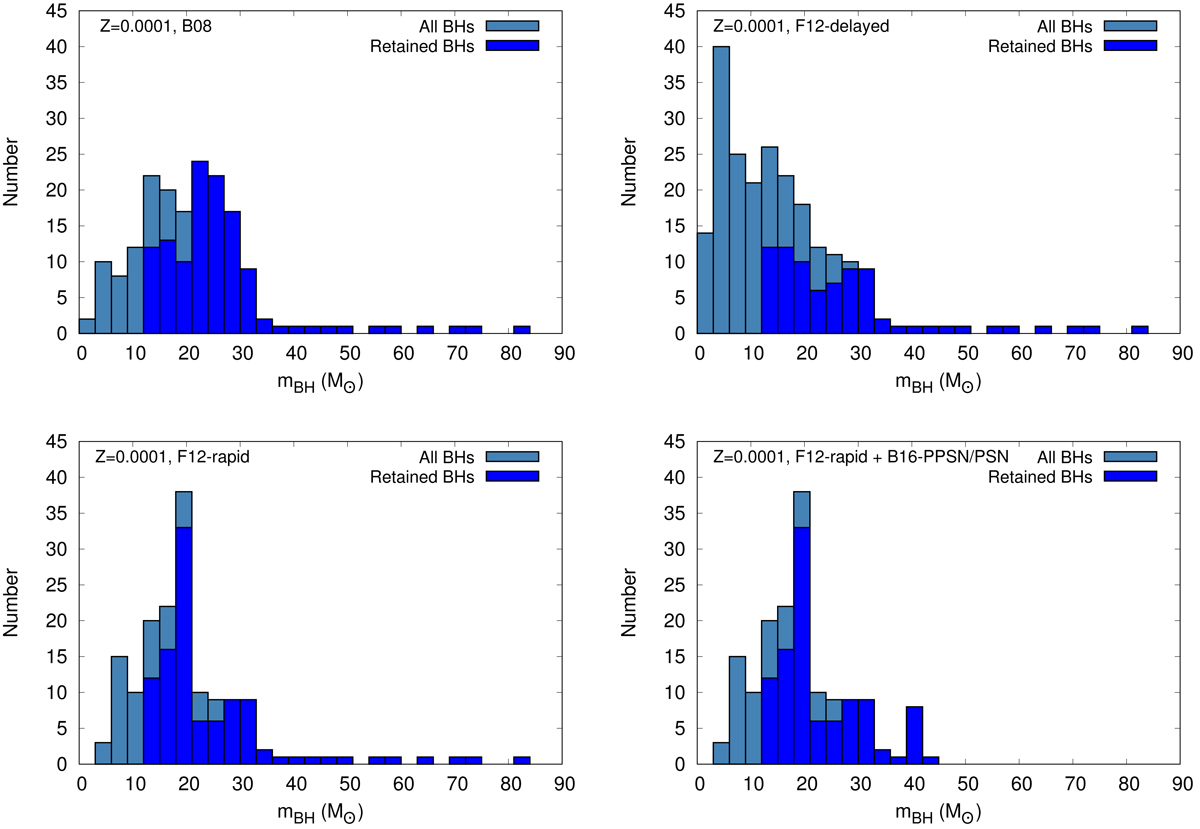
Mass distributions of BHs obtained in the Mcl(0) = 5.0 × 10⁴ M⊙ model clusters (initially all single stars; Sect. 3) for four remnant-formation scenarios as indicated in the legends (Z = 0.0001 taken). On each panel, both the natal mass distribution of the BHs and the distribution at t ≈ 20 Myr cluster-evolutionary time are shown (the steel-blue and blue histograms, respectively). The latter distribution represents well the mass spectrum of those BHs, which remain gravitationally bound to a medium-mass (young massive or open; in this case taken to be of ≈5 × 10⁴ M⊙) cluster after their birth and which are, therefore, available for long-term dynamical processing in the parent cluster (see Sect. 3.1). The retained BH mass distributions (blue histograms), in these panels, are the outcomes of the standard, fallback-controlled natal kick model (Eq. (1)).
Current usage metrics show cumulative count of Article Views (full-text article views including HTML views, PDF and ePub downloads, according to the available data) and Abstracts Views on Vision4Press platform.
Data correspond to usage on the plateform after 2015. The current usage metrics is available 48-96 hours after online publication and is updated daily on week days.
Initial download of the metrics may take a while.