Fig. 4.
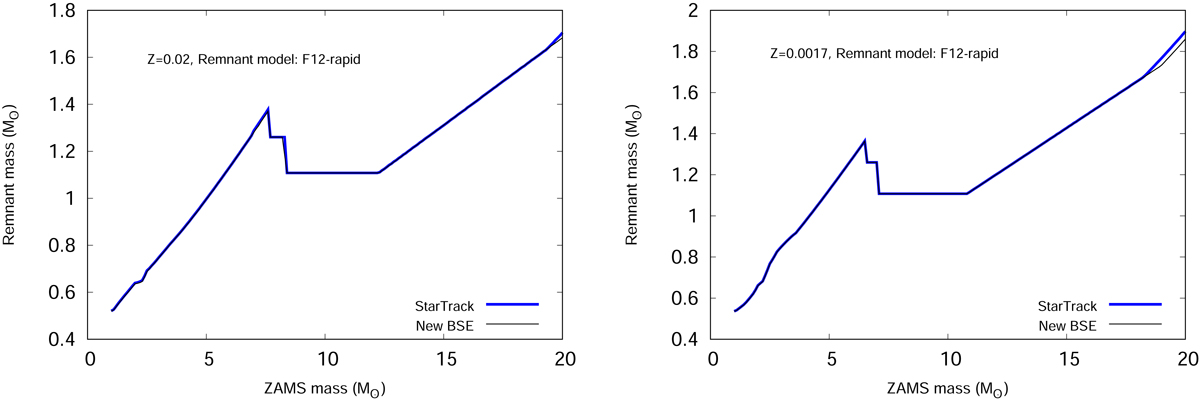
Comparisons of the ZAMS mass-remnant mass relation between the updated BSE (thin, black line) and StarTrack (thick, blue line) for lower ZAMS masses (1 M⊙ − 20 M⊙) for F12-rapid remnant mass model. Over this mass range, the switching from WD formation to NS formation is evident (NS formation from the first drop of the curve to 1.26 M⊙). The comparison is shown for the two metallicities Z = 0.02 and 0.0017.
Current usage metrics show cumulative count of Article Views (full-text article views including HTML views, PDF and ePub downloads, according to the available data) and Abstracts Views on Vision4Press platform.
Data correspond to usage on the plateform after 2015. The current usage metrics is available 48-96 hours after online publication and is updated daily on week days.
Initial download of the metrics may take a while.