Fig. 12.
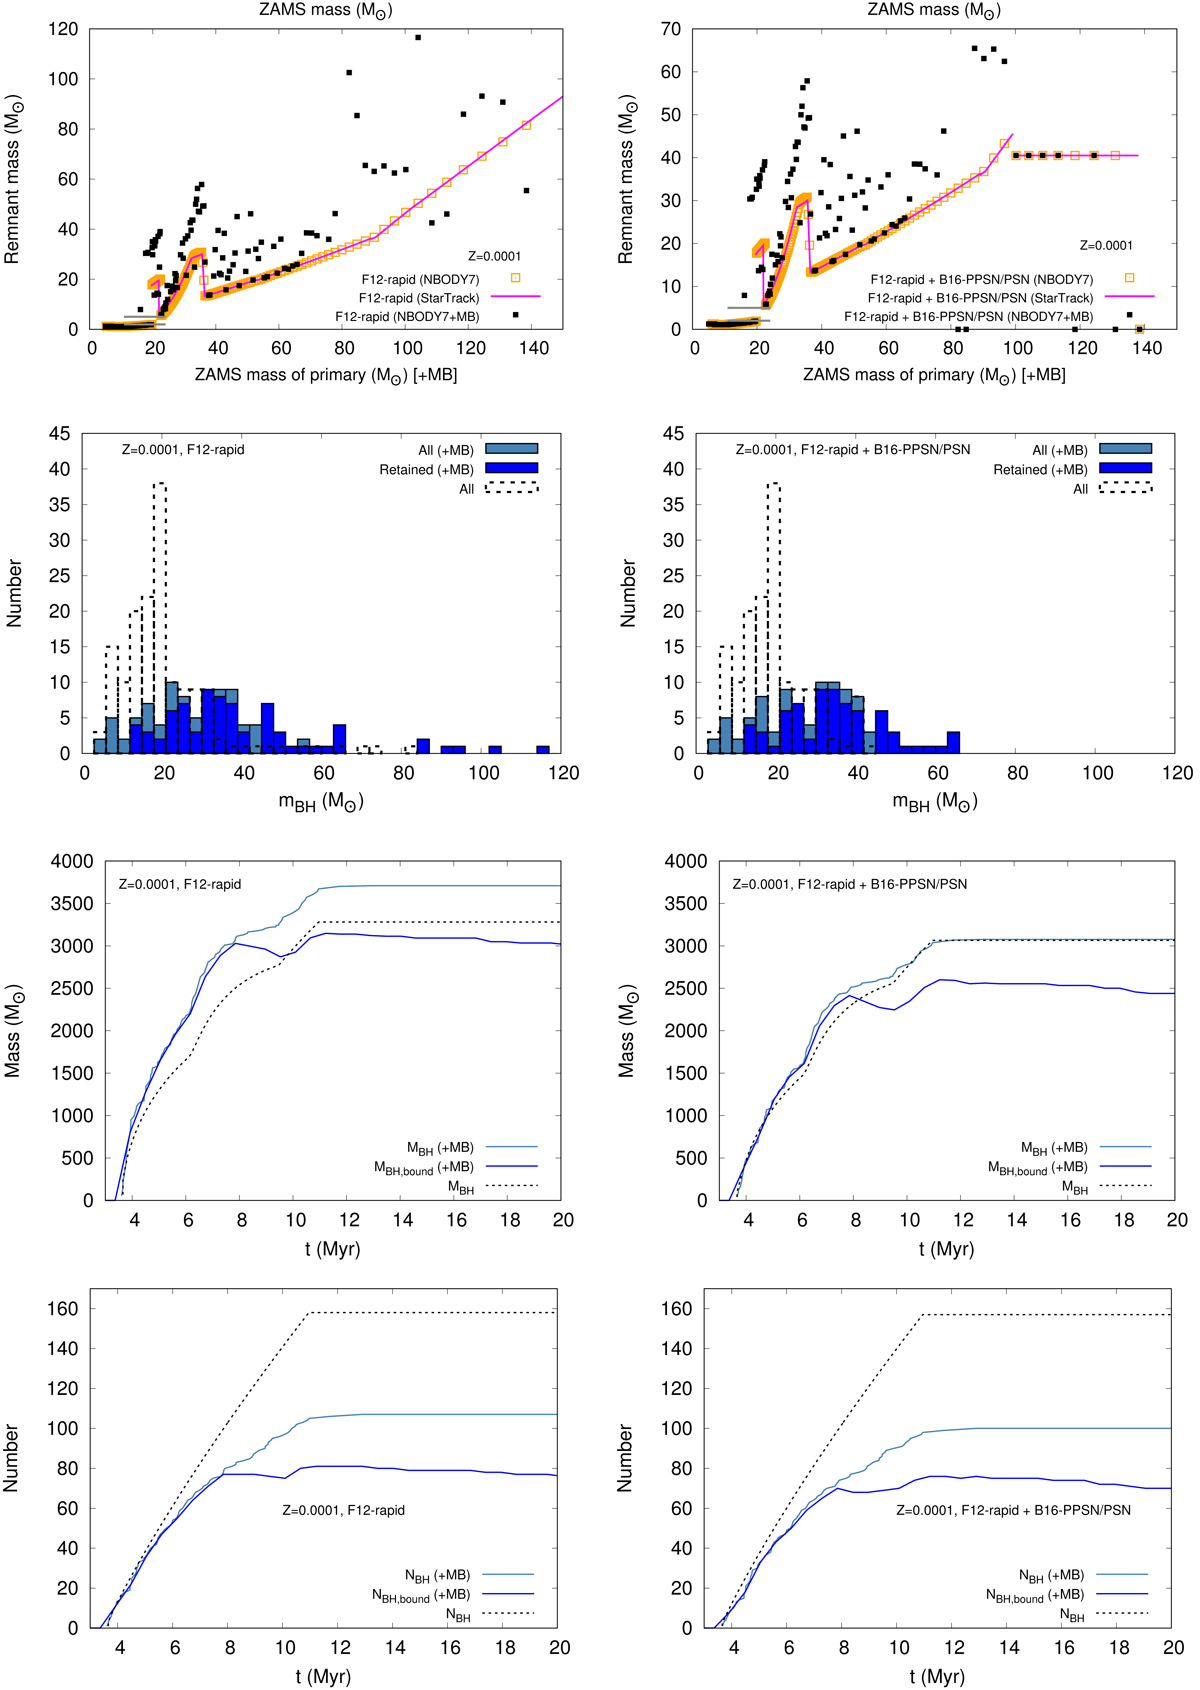
Remnant production and retention in the NBODY7-computed, Mcl(0) ≈ 5.0 × 10⁴ M⊙, rh(0) ≈ 2 pc model cluster with all BH-progenitor stars paired in primordial binaries (see Sect. 4). In all the panels, “+MB” indicates the presence of such a population of massive primordial binaries; the absence of this symbol in a legend implies the case in which all stars are initially single. The F12-rapid remnant-formation prescription and Z = 0.0001 is assumed without (left column) and with (right column) PPSN/PSN. Top row: ZAMS mass vs. remnant mass (black filled squares) compared with the corresponding StarTrack outcomes from pure single-star evolution (blue solid lines; cf. Fig. 6). For the BH progenitors that have undergone a star-star merger before the BH formation, the ZAMS mass of the primary (the more massive of the members participating in the star-star merger, at the time of the merger) is plotted in the abscissa. For reference, the ZAMS mass-remnant mass points (orange empty squares) from an identical model cluster but with initially only single stars (as in Sect. 3; cf. Fig. 6) are also shown. Second row: natal and retained mass distributions of the BHs (steel blue and blue filled histograms, respectively; assuming the standard, fallback-controlled natal kicks). These are compared with the corresponding BH natal mass distribution without any massive primordial binaries (dashed empty histogram, cf. Fig. 8). Third row: cumulative time development of the total BH mass, MBH, as they are born (steel blue solid line) and the total BH mass, MBH, bound, that is bound to the cluster as a function of time (solid blue line). The MBH(t) corresponding to initially only single stars is also shown (black, dashed line). Fourth row: same as the third row but for the BH numbers NBH and NBH, bound.
Current usage metrics show cumulative count of Article Views (full-text article views including HTML views, PDF and ePub downloads, according to the available data) and Abstracts Views on Vision4Press platform.
Data correspond to usage on the plateform after 2015. The current usage metrics is available 48-96 hours after online publication and is updated daily on week days.
Initial download of the metrics may take a while.