Fig. 1.
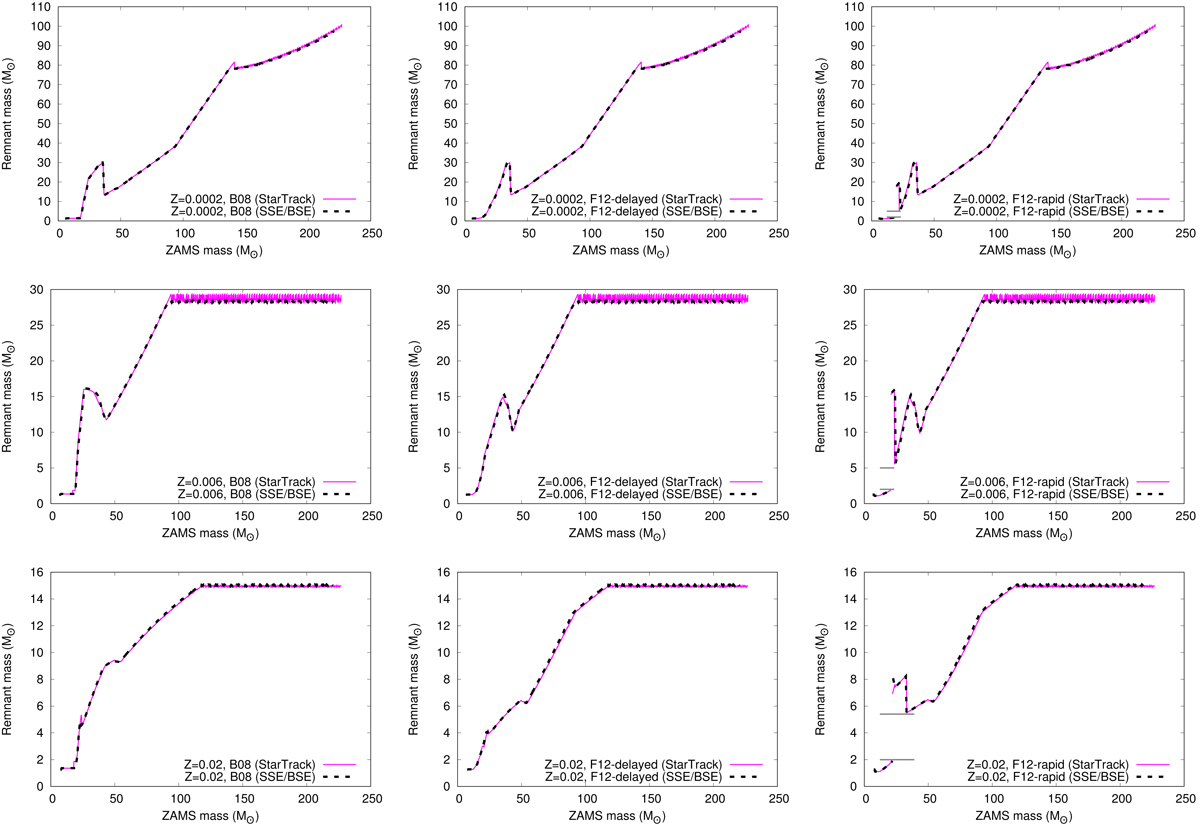
Comparisons of the ZAMS mass-remnant mass relation between the updated BSE (Sects. 2.1 and 2.2) and StarTrack. The comparison is done for the cases of B08, F12-delayed, and F12-rapid remnant-mass models and for the metallicities Z = 0.0002, 0.006, and 0.02, as indicated in the legends. In all cases in this figure, PPSN/PSN is disabled. In all panels, the black dashed line is the outcome from the new BSE and the blue solid line is the corresponding StarTrack result. The mass gap between NSs and BHs, which is characteristic of the F12-rapid remnant mass model, is also indicated in the corresponding panels (the grey, horizontal lines at ≈2.0 M⊙ and ≈5.0 M⊙ in the F12-rapid panels).
Current usage metrics show cumulative count of Article Views (full-text article views including HTML views, PDF and ePub downloads, according to the available data) and Abstracts Views on Vision4Press platform.
Data correspond to usage on the plateform after 2015. The current usage metrics is available 48-96 hours after online publication and is updated daily on week days.
Initial download of the metrics may take a while.