| Issue |
A&A
Volume 638, June 2020
|
|
|---|---|---|
| Article Number | A151 | |
| Number of page(s) | 10 | |
| Section | Planets and planetary systems | |
| DOI | https://doi.org/10.1051/0004-6361/202038120 | |
| Published online | 30 June 2020 | |
Drifting inwards in protoplanetary discs I Sticking of chondritic dust at increasing temperatures
1
University of Duisburg-Essen, Faculty of Physics,
Lotharstr. 1,
47057,
Germany
e-mail: This email address is being protected from spambots. You need JavaScript enabled to view it.
2
University of Duisburg-Essen, Faculty of Physics and Center for Nanointegration Duisburg-Essen (CENIDE),
Lotharstr. 1,
47057
Duisburg,
Germany
Received:
8
April
2020
Accepted:
30
April
2020
Abstract
Sticking properties rule the early phases of pebble growth in protoplanetary discs in which grains regularly travel from cold, water-rich regions to the warm inner part. This drift affects composition, grain size, morphology, and water content as grains experience ever higher temperatures. In this study we tempered chondritic dust under vacuum up to 1400 K. Afterwards, we measured the splitting tensile strength of millimetre-sized dust aggregates. The deduced effective surface energy starts out as γe = 0.07 J m−2. This value is dominated by abundant iron-oxides as measured by Mössbauer spectroscopy. Up to 1250 K, γe continuously decreases by up to a factor five. Olivines dominate at higher temperature. Beyond 1300 K dust grains significantly grow in size. The γe no longer decreases but the large grain size restricts the capability of growing aggregates. Beyond 1400 K aggregation is no longer possible. Overall, under the conditions probed, the stability of dust pebbles would decrease towards the star. In view of a minimum aggregate size required to trigger drag instabilities it becomes increasingly harder to seed planetesimal formation closer to a star.
Key words: planets and satellites: formation / protoplanetary disks
© ESO 2020
1 Introduction
The primary trigger to terrestrial planet formation is growth of dust grains into larger, pebble size aggregates (Blum & Wurm 2008; Johansen et al. 2014; Youdin & Goodman 2005). This growth does not proceed in the same manner in all locations of protoplanetary discs. The most obvious example is the evolution of solids at the water snowline. The snowline separates an inner region with water being only present as vapour and an outer region with water ice (Lecar et al. 2006). Water ice has been considered to be very sticky and to lead to dust traps (Vericel & Gonzalez 2020) or the formation of highly porous planetesimals by sticking collisions alone (Kataoka et al. 2013). It has recently been shown however that the sticking properties of water ice strongly depend on the temperature (Musiolik & Wurm 2019; Gundlach et al. 2018; Gärtner et al. 2017). This might restrict the favourable conditions of icy planetesimals to a small region beyond the snowline, although sublimation and recondensation might play a role (Ros et al. 2019).
However, this nicely shows that the temperature of the environment is important for collisional grain growth. For the inner regions many works considered silica or quartz as representative materials to describe sticking (Blum & Wurm 2008; Dominik & Tielens 1997; Kimura et al. 2015; Steinpilz et al. 2019; Yamamoto et al. 2014). Temperature was less of an issue in this context in the past as SiO2 is not volatile at moderate temperature. A transition has regularly been considered only at the silicate “snowline” (sublimation line) somewhere close to the star with temperatures beyond 1500 K (Morbidelli et al. 2016; Flock et al. 2019; McClure et al. 2013). This picture of one stable silicate with constant sticking properties might be too simple in the context of planetesimal formation.
Inside of the water snowline dust consists of a number of minerals. If we take chondrites as a representative material, we have olivines, pyroxenes, iron oxides, metallic iron, iron sulfide, and carbon-bearing minerals such as graphite just to mention the most abundant materials that can be assembled from the available chemical elements (Braukmüller et al. 2018; Scott & Krot 2014). These minerals might have been subject to aqueous alteration depending on their exact location. Moderate temperature variations have already changed this assembly of minerals as is obvious from the classification scheme of meteorites with respect to thermal alteration (Weisberg et al. 2006). Therefore, grains at a location with 300 K are different from grains at 1000 K in more than one way, including composition, grain size, and morphology.
In this context, it is important to note that solids regularly drift inwards (Weidenschilling 1977). This inward drifting brings minerals which are stable at low temperatures to much warmer regions and some mineral metamorphoses occur. How this influences the sticking properties of dust aggregates is subject of debate and not yet conclusive. In an initial study, de Beule et al. (2017) researched the tensile strength of JSC Mars simulant dust tempered in air, which is based on a new tensile strength measurement technique (Musiolik et al. 2018). These authors find some increase of sticking with increased temperature, although a decrease beyond 1000 K would also be in agreement with the data. Demirci et al. (2017) carried out collision experiments in which basalt grains grew self-consistently to a maximum size (bouncing barrier). They found that sticking decreases for dust tempered beyond 1000 K as aggregates only grew smaller then. This might also be important in view of recent calculations of planet formation in this hot region by Flock et al. (2019). These authors find a particle trap located at 900 K, which might just be a sweet spot for particle growth as itmight be dry and sticky (Steinpilz et al. 2019) but not yet be too hot for decreased sticking (Demirci et al. 2017).
In all these measurements grains were studied after they cooled down. Therefore, these measurements did not trace sticking at high temperature with all aspects of sticking at high temperatures, but only the influence that composition or grain size and shape mightprovide. Certainly, high temperature during a collision might have its own influence superimposed on this, that is from varying viscosity. As an example, Bogdan et al. (2019) show that the coefficient of restitution for basalt grains starts to decrease at about 1000 K. Also, Demirci et al. (2019) find sticking probabilities to be increased for basalt in slow collisions for 875 K upwards.
We continue along these pathways by studying systematically how grains in a chondritic sample, milled to dust and subject to different temperatures stick to each other. In contrast to previous studies, we temper under vacuum in this work. We also use standard splitting tensile strength measurements (Brazilian tests) and relate the results to changes in composition and morphology of the material provided by Mössbauer spectroscopy and grain size analysis.
This work includes a number of measurements, analyses, and interpretations. For clarity, we provide a detailed analysis of a data set that measures contact forces “as they are” in the laboratory. No special concern is taken with respect to surface water in this work. From a recent work by Steinpilz et al. (2019), based on a suggestion by Kimura et al. (2015), we know that surface water is important for the measurement of sticking properties. Especially in view of higher temperatures, silicates loose any surface water they would carry from the snowline and their sticking would initially increase as they dry. We note that this modifies the findings of this paper. However, this process is more complex and that work is currently still ongoing. The principle results of this paper still hold as the underlying evolution of the stickiness of chondritic matter.
2 Laboratory experiments
2.1 Chondritic dust
We consider an initial mix of minerals drifting inwards in protoplanetary discs. In the laboratory, we simulated the drift by tempering the material at increasing temperatures. As far as the sample is concerned, this is an empirical study. We do not consider in detail, which minerals would change into new minerals depending on the detailed compositions from first principles. We rather intend to sample the early solar nebula in its origin as well as possible. Therefore, we used chondritic material in this study. We acquired a meteorite (Sayh al Uhaymir 001), which is classified as L4/5 chondrite. This is different from the materials used in earlier studies (Demirci et al. 2017; de Beule et al. 2017). We relied on the vendor for the classification in this work. Cutting the stone, it shows chondrules and metal inclusions in parts, but otherwise we did not do any further analysis to verify the chondrite type. In the context of this study, this is of minor importance, especially as we traced the composition upon heating in detail (see below).
Tempering this chondritic material might have two effects. First, the internal mineral phases might change into new mineral phases. The surface of minerals subject to a gaseous environment or vacuum (or inert gas) might change in a different way (Braukmüller et al. 2018). It is therefore important if the whole stone is tempered or if the stone is ground first and the dust is then tempered. In the latter, there is a large effective surface that is subjected to the environment. In view of our interest in dust evolution, the meteorite has to be ground before being subject to higher temperatures.
Second, the grain size is also important as sticking properties strongly depend on it. Tempering might change the effective grain sizes. We do not aim at producing exactly a grain size that might have been present in the solar nebula, which is hardly possible. However, in the comparison of samples tempered differently, the initial grain size has to be at least the same. A further requirement is that the particles have to be small enough to be sticky at all to allow tensile strength measurements using a Brazilian test. Grains are therefore in the micrometer range. We developed a sequence of milling the material in the same way and used the same batch of ground material for a series of tempering.
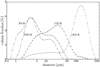 |
Fig. 1 Grain size distribution (volume fraction) for tempered samples. Two examples for sizes below 1250 K (300 and 1000 K) are similar. At higher temperature the grain size shifts to larger sizes. The sample at 1400 K is dominated by large grains of 142 μm. |
2.2 Measurement sequence
In total we only had about 20 g of the meteorite available. As tempering changes the material, a certain sequence for the different measurements had to be set up. A part of the heated material at each temperature was used for Mössbauer spectroscopy. This sample is not destroyed during this procedure and is afterwards also used for measuring the size distribution in the sample. Tensile strength measurements were carried out with the main part of the material. These measurements are representative of the temperatureat which the material was tempered. Afterwards, the material was subjected to a higher temperature. Owing to this alteration, no more measurements at lower temperatures are possible unless a new batch of material is prepared.
2.3 Grain size evolution with temperature
Figure 1 shows examples of the (volume) grain size distribution measured with a commercial instrument (Mastersizer 3000). The instrument determines grain sizes by light scattering and Mie analysis, thus giving equivalent diameters of spherical grains based on optical properties.
Optical constants enter into these calculations and we used n = 1.518 + 0.001 i as refraction and absorption index, respectively, throughout all measurements. This has to be kept in mind as small differences during the evolution of the sample might be related to small changes in optical constants and to changes in grain shape. However, the samples only show a significant increase in grain size at temperatures beyond 1250 K. Figure 2 shows the evolution of the average grain size with temperature.
Up to 1250 K the size can be considered to be constant with a mean diameter of 9.7 ± 2.5 μm. The diameter increases to 16.6, 23.7 and 142.1 μm for 1300, 1350, and 1400 K, respectively. We used the volume-averaged grain size for the calculations below as we consider this to be the relevant quantity in our context of the Brazilian test (see below). Not used but noted for completion, the number averaged grain size is a factor of seven smaller.
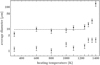 |
Fig. 2 Grain size evolution with temperature. The volume-averaged grain sizes (squares) and the number averaged grain sizes (triangles) are shown. A line indicates the mean diameter of 9.7 ± 2.5 μm for the temperature range from 300 to 1250 K based on the volume-averaged grain size. |
2.4 Bulk density evolution
As seen below, the Brazilian test strongly depends on the volume filling factor of a cylindrical dust aggregate. While the total volume and mass of an aggregate can be determined to high accuracy, the volume filling factor also depends on the density of the dust grains, which changes with change in composition upon tempering. The meteorite as uncut stone has a density of 3.44 g cm−3 based on volume measurements with a pycnometer. As chondrites have a certain porosity, the average grains of a powder after milling might have a somewhat higher density. As approximation for the powder we used the composition calculated from the Mössbauer measurements (see below). We note that this only includes ferric phases. However, it traces a slight decrease in density withincreasing temperature as seen in Fig. 3 and we used these values for the samples tempered at the different temperatures, respectively.
2.5 Tempering
Exemplary studies (not shown), where the sample was kept at similar temperatures for 100 h instead, showed that the duration has no significant influence on the minerals formed with a moderate decrease of phase transition temperatures by approximately 100-150 K, as compared to dust heated for one hour we focus on in this study. We therefore consider a heating time of 1 h to be a good representation of possible processes in a protoplanetary disc. As dust components transform into other minerals with higher condensation temperatures, we also do not expect changes in grain size for longer heating duration at least up to 1250 K. Up to this point, we are still below the melting point of the abundant olivine.
In detail, fayalite, as an iron-rich end member of olivine, has a melting temperature of 1200 K at low pressure (Hsu 1967). The meltingtemperature increases with increasing Mg-content of the olivine up to 1900 K for forsterite (Ohtani & Kumazawa 1981). The large grain size at 1400 K suggests that the melting point of the olivines of the given composition is reached at this temperature, matching the intermediate Fe content in silicates as determined in Mössbauer spectroscopy (see below).
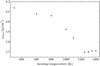 |
Fig. 3 Evolution of the bulk density of the material calculated from the composition determined in Mössbauer measurements. |
2.6 Mössbauer spectroscopy measurements
Mössbauerspectra were recorded using a constant acceleration set-up and a 57Co(Rh) source. To obtain spectra in a wide temperature range including magnetic phase transitions of the iron-bearing minerals, a liquid helium bath cryostat (CryoVac) was utilised. The temperature range of 4.3–60 K was studied in detail to monitor magnetic phase transitions of iron-bearing silicates and the transition to the superparamagnetic (SPM) behaviour of nanophase iron oxide. Mössbauer spectra were theoretically reproduced using the Pi program package developed by U. von Hörsten (von Hörsten 2019). All values for the isomer shift δ are given relative to that of α-Fe at room temperature (δα−Fe = −0.107 mm s−1) (Barb 1980).
2.7 Cylinder preparation
The procedure described above provides the base treatment of grinding and tempering of the meteorite. For the tensile strength measurements by means of the Brazilian test, this powder has to become a cylinder of dust. For a measurement, the dust is therefore pressed in cylindrical moulds of 7.99 ± 0.05 mm diameter and 6.89 ± 0.49 mm height. Varying the compression force provides different average densities or volume filling factors. This process is carried out manually because, depending on the evolution of the contact forces, more or less pressure is needed to provide a stable cylinder. The cylinders later break as supposed to in a Brazilian test (see below), and we consider the inner structure after compression to be homogeneous.
The mass of each cylinder was measured using a microscale. The mass was divided by the volume of the cylinder to get the average cylinder density. The ratio of the cylinder density to the bulk density of the dust estimated above gives the volume filling factor Φ
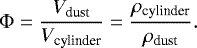 (1)
(1)
2.8 Tensile strength experiments
A basic quantity for aggregation is the force Fb needed to break one contact between two grains. For two (hard) spherical particles with reduced radius R that are of same material and have a surface energy γ, this can be calculated as (Johnson et al. 1971)
 (2)
(2)
This simple equation clearly visualises the two basic parameters important in this context, the surface energy and the particle size. It has to be noted that the sticking force increases linearly with grain size. So in a static sense, two large grains are more sticky than two small grains. However, in a given cross section of an aggregate of tightly packed grains the number of contacts depends on 1∕R2. Therefore, aggregates composed of smaller grains, in general, are more stable.
Contact forces between two dust grains can in principle be measured directly, for example as done by Heim et al. (1999), with atomic force microscopy for spherical grains. However, Eq. (2) is an idealisation of any natural dust sample. Dust always comes in polydisperse samples to some degree with some variation in particle size. Grains are usually not spherical but irregular. Therefore, the contact force depends on the specific contact in an assembly and the local surface curvature. In addition, in a mix of minerals the surface energy also varies depending on the mineral species. It would therefore be a tedious task to measure sticking forces between individual grains of the chondritic dust and elaborate on its consequences.
To immediately get the important average value, we measured the splitting tensile strength σ of dust aggregates here. The tensile strength of dust aggregates is connected to the contact force by Rumpf’s equation (Rumpf 1970), that is
 (3)
(3)
In this equation, N is the coordination number (number of touching neighbours), d is the diameter of an individual grain, and F is the relevant average force to break a contact. This force might be the sticking force of Eq. (2) but it might also be rolling or sliding forces, whichever is weaker. All forces depend on the surface energy γ however (Dominik & Tielens 1997; Kimura et al. 2015; Musiolik & Wurm 2019).
To measure the tensile strength, we used a well-established method known as the Brazilian test. Examples where this technique has been applied in the context of matter in protoplanetary discs are Meisner, T. et al. (2012), Gundlach et al. (2018), and Steinpilz et al. (2019). A sketch of the set-up we built for this purpose is shown in Fig. 4. Pressure is applied onto the mantle face of each cylindrical sample until it breaks into halves. The peak force Ft applied is measured by a force sensor and can be translated into the tensile strength
 (4)
(4)
with diameter dc and length L of the respective cylinder. The experiment is carried out at ambient conditions, that is room temperature and laboratory humidity.
Figure 5 shows the tensile strength measurements with tensile strength over filling factor for different temperatures.
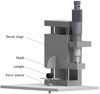 |
Fig. 4 Experimental set-up. By driving down the linear stage, the blade applies a force onto the cylindric sample until it breaks. The peak force is measured by a force sensor. |
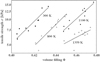 |
Fig. 5 Tensile strength σ over volume filling factor Φ for tempered samples. Power laws are fitted to the data according to Eq. (6). |
3 Data analysis and interpretation
3.1 Tensile strength and volume filling factor
To reduce the tensile strength data shown above, we start from Rumpf’s equation (Eq. (3)). The volume filling factor Φ is included explicitly but also implicitly in the number of contacts N. It has to be considered that also the average Force F per contact depends on the filling factor for irregular grains. As the material is compressed, grains shift, contacts rearrange, and small force contacts with small asperities might be traded for larger contact areas and higher forces. Therefore, Eq. (3) is written as
 (5)
(5)
In a first approach, for aggregates that are not too extremely compact and in agreement to Fig. 5, the total Φ-dependence of σ in each data set can be described by a power law
 (6)
(6)
Four examples with power law fitted to the data are shown in Fig. 5 spanning the whole temperature range.
Because the total dependence is a power law, we assume that, within the range of data, each of the Φ-dependent factors is a power law in Φ, or
 (7)
(7)
We then get
 (8)
(8)
In this equation, N0 and F0 are the number of neighbours and average contact force at a certain volume filling factor Φ0 that has to be chosen arbitrarily and should be in the range of filling factors studied. As Eq. (8) holds for all filling factors (within the data range) the power index is written as
 (9)
(9)
Figure 6 shows all fitted power indices a for the different temperatures at which the material was tempered at.
Up to about 1250 K, the power indices do not vary significantly within the uncertainties. This is plausible if the grain sizes and shapes do not change significantly, which is consistent with the particle sizes measured. Then the arrangement of grains would always be similar at a given filling factor.
For the two highest temperatures at 1300 and 1350 K with tensile strength measurements, the power index is significantly lower. Therefore, the number of contacts or the force itself changes in a different way than for the lower temperature data.
In addition to these considerations on power indices, Eqs. (8) and (6) also yield
 (10)
(10)
As we are interested in forces, the force is written as
 (11)
(11)
The force strongly depends on grain size, which we did set kind of arbitrarily by grinding. As size d we take the experimentally determined volume-averaged grain size. Knowing the force, a size independent quantity that is still better suited for applications is the effective surface energy.
3.2 Surface energy
We have to keep in mind that systematic subtleties go along with irregular grains and especially that the reduced radii at the contacts are important. However, having said that, we can still use a sticking force as given in Eq. (2) to define an effective surface energy γe or
 (12)
(12)
We note that Steinpilz et al. (2019), based on findings by Omura & Nakamura (2017), used a sliding force instead, but that was for monodisperse spherical grains of well-known diameters. As we have irregular grains in this case, we used the original JKR equation (Eq. (12)), which together with Eq. (11) gives the effective surface energy as
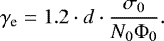 (13)
(13)
The average coordination number N0 has to be between 2 (chains) and 12 (hexagonal close packing), although for irregular grains variations are possible. At the lowest filling factor measured, N0 = 5 seems appropriate (Rumpf 1970). At the highest filling factor, N0 = 8 seems reasonable. These are just plausible values however (Omura & Nakamura 2017; Steinpilz et al. 2019). Considering that some variation would be possible this adds some systematic uncertainties. In this case we used the mean filling factor Φ0 =0.44 of the measured range and the mean coordindation number N0 = 6.5. Putting in these numbers for the measured data at room temperature, the effective surface energy is γe = 0.07 J m−2 under ambient conditions. We emphasise that this is an effective surface energy, defined by Eq. (13) applicable to our problem. We therefore refrain from attributing an error to this value.
Independent of the absolute values, the surface energies for different temperatures can be set in relation to each other. In this context, however the power indices of the volume filling factor dependences are important. For varying power index, the choice of Φ0 matters strongly as σ0 would vary in different ways. However, Fig. 6 shows that the power indices do not significantly vary up to 1250 K. Also the grain sizes of the samples (see above) only start to increase significantly beyond 1250 K. The data up to 1250 K are therefore consistent with a constant power and constant grain size. To remove the Φ-dependence in the comparison, we therefore took a constant power index as a plausible assumption and fitted the tensile strength measurements again, but now with the average power index for temperatures up to 1250 K being fixed to the same value for all these temperatures. We also used the same average grain size of 9.7 μm in Eq. (13). Up to 1250 K the ratios of the surface energies are now independent of the choice of Φ0 and are shown in Fig. 7. The reference for all ratios is room temperature.
For the two highest temperatures shown at 1300 and 1350 K, we used both the measured power index and the measured average grain size. However, in this case, because of the different powers of the tensile strength on filling factor, it now matters at which filling factor the surface energies are compared to each other. This is not an artefact of some scaling. The underlying mechanism for this dependence, as outlined above, is a real dependence of the average sticking force on filling factor. Irregular grains just do not have one given sticking force. And as grains of irregular shape are compressed into an aggregate, the specific contacts change. Up to 1250 K this dependence is the same for all samples. Beyond that temperature, as the increase in average grain size and the change in power indices suggest, the morphology of the grains might change as well, which translates to a variation of the effective surface energy with volume filling factor.
It might be noted, that even though up to 1250 K, the filling factor dependence of γe was removed from the ratio of the effective surface energies, there is still a dependence of γe on Φ. The index a2 related to this cannot be deduced from the data set. However, if the variation in the high temperature values would be taken as guidance, γe might vary by a factor of 2 for different filling factors.
Anyway, in general, keeping the volume filling factor constant, the effective surface energy decreases by a factor of about five from room temperature to 1250 K orto γe = 0.014 J m−2. Compared to literature values for crystalline silicates this is about two orders of magnitude less (Parks 1984). However, we note that this is only an effective value. A reduction of two orders of magnitude has been suggested by Kimura et al. (2014) resulting from asperities providing only smaller contacts. The absolute value would be in rough agreement to this idea, keeping in mind that the compositional changes then add another factor to this. We added a linear trend to the data as we lack a more detailed model. For 1400 K no stable aggregates could be generated owing to the large olivines growing (see grain sizes above).
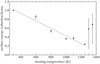 |
Fig. 7 Ratio of the surface energy at temperature T to that at room temperature (γe(T)∕γe(300 K)). Typical error bars are of the order of 5%. The line is a linear trend fitted to the data up to 1250 K. Error bars for the two highest temperatures are due to volume filling factor dependent differences in contact force or effective surface energy. |
3.3 Composition of the untreated material probed by Mössbauer spectroscopy
The evolution of the effective surface energy with temperature has to be tied to the compositional changes we trace by Mössbauerspectroscopy. For the spectra of the unheated sample and a detailed analysis see Appendix A.
All Mössbauer parameters for the spectrum measured at 293 K are listed in Table 1 and no relevant concentration of additional mineral phases was indicated by X-ray diffraction (XRD). As the relative spectral area A of a mineral approximately represents the amount of iron in this phase relative to the total amount of iron in a material, it is possible to estimate the percentage of weight for all minerals in the sample. This is analysed and discussed in more detail in Appendix A. Furthermore the dependence of the SPM crystallites on environmental temperature delivers insight into their grain sizes, which is discussed in Sect. 3.5.
3.4 Composition of the tempered material probed by Mössbauer spectroscopy
Mössbauer spectra were analysed in this manner for a total of ten powder samples heated at different temperatures. Spectra for the samples tempered at the highest temperature (1400 K) are shown and discussed in Appendix B. It is noticeable that an exposure to high temperatures changes the composition of chondritic material considerably.
The dependence of the relative spectral areas, A, of the individual minerals on the temperature they were exposed to prior to the Mössbauer analysis is depicted in the top panel of Fig. 8. In this figure the values of A for every heating temperatureTH were each extracted from their room temperature spectra. While the amount of Fe3 O4, olivine, and pyroxene is roughly constant for moderate tempering, the sextet structure of kamacite can only be detected for temperatures up to 600 K. After heating at 800 K, no α−(Fe,Ni) is left in the chondritic sample. Exceeding TH = 1000 K the amount of Fe3O4 begins to decrease with every tempering step, until it vanishes completely after exposure to a heating temperature of 1300 K. This is accompanied by an increase of the spectral area of olivine. After exposures to higher temperatures the types of included minerals, olivines, and pyroxenes no longer change, but the spectra become more dominated by the olivine doublet. We have to keep in mind that the relative spectral area of a mineral is approximately proportional to the number of iron atoms in the sample structuring this exact mineral. Therefore a phase with a higher iron content but the same weight percentage as another, iron-poorer phase in the sample results in a greater relative spectral area. For this reason, all results in Fig. 8 have been converted into weight percentages based on the following assumption on stoichiometries: Fe3O4 for iron oxide, Fe0.95Ni0.05 for kamacite, MgFeSiO4 for olivine, and MgFeSi2O6 for pyroxene. With these values, the dust bulk density ρDust(TH) could be estimated as depicted in Fig. 3.
3.5 Influence of tempering on nm-grain sizes
Besides overall size variations measured by light scattering as quantified above, the Mössbauer data also suggest that iron oxide crystallites become larger. Superparamagnetism occurs when the magnetic anisotropy energy of crystallites EA = Keff V, where Keff is the effective anisotropy constant of the crystallite and V its volume, is comparable to the thermal energy ETh = kB T. Decreasing the particle volume allows for thermal fluctuations of its magnetically coupled spin moment, leading to anet paramagnetic behaviour while still maintaining magnetic order. By comparing the areas of SPM to FM magnetite in the Mössbauer spectra, we get an insight into the influence of tempering on Fe3 O4 crystallite sizes.
Figure 9 depicts the fraction of the SPM magnetite doublet area in relation to the total area assigned to magnetite (SPM doublet plus FM sextets) extracted from Mössbauer spectra. The blocking temperature TB is defined as the temperature, where the SPM doublet area equals the sextet area, or speaking in terms of energy, where the magnetic anisotropy energy EA approaches the thermal energy ETh. It becomes clear that a growing crystallite volume would result in an increased blocking temperature and could explain the experimental observation. For the untreated dust sample, TB is around 60 K, while a heating temperatureof 600 K already raises TB to approximately 125 K. The trend of increasing blocking temperatures continues with every tempering event until no more magnetite can be detected in the chondritic powder at approximately 1250 K. This indicates a growth of nanophase Fe3O4 as well as possibly an agglomeration of multiple individual adjacent crystals. Using isolated magnetite nanoparticles as a reference, the increase of TB suggests a growth beginning atapproximately 4-5 nm to 15-20 nm for powders heated up to 800 K (Landers et al. 2016; Goya et al. 2003; Häggström et al. 2008). As particle size in general, but also the size of asperities on surfaces, is important for sticking forces, this influences the effective surface energy.
Mössbauer parameters of all iron-bearing phases identified in the spectrum of the unheated sample measured at room temperature.
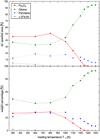 |
Fig. 8 Top panel: relative spectral area of the contribution of each mineral to the fit. Bottom panel: weight percentages of all minerals obtained through their relative spectral areas. |
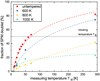 |
Fig. 9 Fraction of SPM Fe3O4 doublet area compared to the total Fe3O4 contribution for the untreated dust sample and three different heating temperatures TH. The dashed lines serve as a guide to the eye. |
4 Conclusions
We followed the evolution that chondritic material might go through if it drifts inwards in protoplanetary discs. We tempered chondritic dust, milled from a meteorite, at increasing temperatures under vacuum. For each tempered sample, we measured its (ferric) composition by Mössbauer spectroscopy, determined the grain size, and measured the tensile strength of dust aggregates to answer why and how the sticking properties change in warm parts of protoplanetary discs.
Initially four iron-bearing minerals are present, namely metallic iron or kamacite, iron oxides, olivines, and pyroxenes; we note that no additional minerals could be identified by XRD. With increasing temperature the metallic iron already vanishes at moderate temperatures of about 700 K. Iron oxide grains initially grow in size on the nanometer scale. But the mineral starts to decrease in abundance at about 800 K, while the relative amount of olivine increases, which could be explained by iron being integrated into the olivines. The iron oxides are completely vanished at about 1250 K. At the same time, the abundance of olivines levels off. Pyroxene, which is also initially present, starts to decrease in abundance at about 1000 K, yet some pyroxenes are still present at 1400 K.
These transformations are related to the evolution in sticking properties. The effective surface energy under ambient conditions at room temperature is γe = 0.07 J m−2. The surface energy monotonously decreases by about a factor of five up to 1250 K. The high initial effective surface energy and the decrease are related to the iron oxide. The final effective surface energy of γe = 0.014 J m−2 is dominated by the olivines, keeping in mind that the effective value is reduced by about two orders of magnitude compared to literature values for crystalline silicates; this decrease is probably due to asperities dominating the contacts.
The average grain size on the micrometer scale stays the same. Thus changes in contact forces due to variations in the “real” surface energy (composition) and surface curvature, for example from nano-scale changes of grain sizes, both enter in the effective surface energy.
At still higher temperatures in the range of 1300–1400 K grains microscopically change size. The effective surface energy now increases but the increase is sensitive to the filling factor of the aggregates. This is due to the mentioned effect that the influence of grain shape and contact curvatures are traced by the effective surface energy. Depending on the compression of an aggregate these contacts change. While the effective surface energy increases at the high temperatures, aggregates are still weaker owing to the larger grain size. At 1400 K there is a huge increase in grain size. The sample mass is dominated by grains of about 142 μm diameter then. Stable aggregates can no longer be formed.
This indicates that at temperatures higher than 1300 K collisional growth in a sample of chondritic composition is not likely or other mechanisms take over, that is collisions of very sticky sand-size grains close to the melting point of olivine (Bogdan et al. 2019). Melting, or at low pressures, sublimation on longer timescales and recondensation might be an option to form large bodies or only large pebbles. But this would be more of a snowline analogue, which is outside the focus of this paper. Consistent with our findings, Morbidelli et al. (2020) just published a work, suggesting that first planetesimals formed right at this high temperature snowline.
For the lower temperatures, where this is not an issue yet and collisional growth would be the growth mode of choice, we note that we measured under ambient conditions; that is we did not yet take into account that humidity influences surface energies strongly (Steinpilz et al. 2019). Subsequent studies on this must complement the data presented in this paper.
With this in mind, it is not yet possible to give a complete picture on particle aggregation in the inner disc. However, based on the subset of data presented, the strong decrease in surface energy indicates that aggregates grow smaller at higher temperature. The influence of water does likely not alter this general trend. The details will be discussed in a second paper.
If the size of aggregates determines if planetesimal formation is seeded, for example by drag instabilities, the likelihood for planetesimal formation decreases with decreasing distance (or increasing temperature) towards the star with an aggregation limit below 1300 K and a hard snowline limit at 1400 K, where other effects might or might not favour formation again.
Acknowledgments
This project is supported by DFG grants WU 321/18-1, WE 2623/19-1 and WE 2623/7-1. We would also like to thank the anonymous reviewer.
Appendix A Composition of the untreated material probed by Mössbauer spectroscopy
Figure A.1 shows the evolution of Mössbauer spectra for the untreated sample measured at various temperatures from 4.3 K to 293 K. At room temperature (bottom panel) the spectrum is dominated by three doublet subspectra reflecting the SPM behaviour of individual iron-bearing phases. Iron-bearing olivines and pyroxenes show no magnetic ordering at room temperature, resulting in a paramagnetic doublet structure in Mössbauer spectra. With an isomer shift δ of about 1.15 mm s−1 the green and blue doublet can be assigned to members of the olivine ([MgxFe1−x]2SiO4) and pyroxene group ([MgxFe1−x]2Si2O6]), respectively. Quadrupole splittings ΔEQ of approximately 2.9 and 2.0 mm s−1, respectively, indicating a 2+ valence for the probed Fe-sites support these assignments (Oshtrakh et al. 2008; Klima et al. 2007; Dyar et al. 2006; Sklute 2006).
The remaining pink doublet exhibits Mössbauer parameters which are typically found in iron oxide Fex Oy nanoparticles. Sufficiently small nanoparticles show a SPM behaviour, that is thermally excited relaxation of the net magnetic moments between easy magnetic directions, leading to the appearance of a doublet structure. Larger magnetic particles might still cause a sextet structure, which can indeed be found in the spectrum (orange). Its isomer shift of approximately 0.35 mm s−1, indicating a contribution of Fe3+ and a hyperfine field of roughly 49 T, suggests either ferrimagnetic magnetite Fe3O4 or maghemite γ −Fe2O3 (Lyubutin et al. 2009; Kuzmann et al. 2003). These iron oxides can normally be identified by the occurrence of two sextet structures caused by Fe3+ on the A- or B-site, respectively. As a consequence of the low amount of magnetically blocked iron oxide in the sample, those two lines cannot be resolved in the room temperature spectrum. Low enough temperatures, however, cause SPM nanoparticles to show magnetically ordered behaviour, which leads to an increase in the spectral area of the sextet and the possibility to resolve two sextet subspectra. An XRD study (not shown here) points to the existence of magnetite rather than maghemite in the sample.
With a rather small relative area a final mineral is discernible by a sextet structure (grey). Its hyperfine field of about 33 T and negligible isomer and quadrupole level shift suggest the assignment to α − Fe (Preston et al. 1962). A mineral often found in meteorites showing α −Fe-structure is kamacite α − (Fe, Ni) (Grandjean et al. 1998; Cadogan & Devlin 2012; Zhiganova et al. 2007; Menzies et al. 2005), where the fraction of nickel is lower than 10%. As there are no other subspectra visible, the untreated powder shows no iron-bearing phases other than olivine, pyroxene, magnetite, and kamacite.
By lowering the temperature, magnetic phase transitions can be observed. At 20 K (Fig. A.1, middle panel) the sample temperature falls below the blocking temperature of some of the nanophase Fe3 O4, resulting in a partial conversion of the SPM doublet to the ferrimagnetic asymmetric sextet structure. The relative spectral area of the sextet increases so that the single A- and B-site subspectra can be resolved (orange and dark red, respectively). The olivine, pyroxene, and kamacite subspectra are not affected that strongly by this drop in temperature.
Sufficiently low temperatures lead to spontaneous ordering of iron magnetic moments in iron-rich olivines. By cross checking the determined transition temperature with literature values for Néel temperatures of olivines, it is possible to estimate the iron content in this mineralic phase on which the ordering temperature strongly depends. After cooling the powder down to liquid helium temperature, the Mössbauer spectrum shows some dramatic changes (Fig. A.1, top panel). Iron in olivines is positioned on two non-equivalent sites, namely the M1- and M2-site (de Oliveria et al. 1991). The magnetic moments of iron on these two positions exhibit an anti-ferromagnetic (AFM) order, corresponding to two complex octet structures (lime green and dark green, respectively). Owing to the distribution of iron contents in the olivines existing in the sample, the lines of these octets are broadened and therefore reproduced using a distribution of hyperfine magnetic fields. Fits based on the Mössbauer parameters for AFM olivines by Lottermoser et al. (1995) lead to a good agreement to the measurement. Furthermore, the paramagnetic olivine doublet decreases in spectral area. A detailed study of this magnetic phase transition, measuring numerous Mössbauer spectra in a temperature range between 4.3 and 20 K, shows that the olivines contained in the sample have a maximum Néel temperature TN = 18 K. As the Néel temperature of olivine group members increases the more iron they contain, the Fe content of ![Mathematical equation: ${[\textrm{Mg}_{x}\textrm{Fe}_{1-{x}}]_2\textrm{SiO}_4}$](/articles/aa/full_html/2020/06/aa38120-20/aa38120-20-eq16.png) present can be roughly estimated to intermediate values of x ≈ 0.5 (Hoye & O’Reilly 1972; Belley et al. 2009).
present can be roughly estimated to intermediate values of x ≈ 0.5 (Hoye & O’Reilly 1972; Belley et al. 2009).
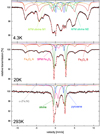 |
Fig. A.1 Mössbauer spectra of the unheated sample measured at 4.3 K (top), 20 K (middle), and room temperature (bottom). Contributions from various iron-bearing phases are tagged. |
Aside from that, the increase of magnetically blocked iron oxide is visible to the point where no SPM doublet can be identified in the Mössbauer spectrum. At 4.3 K, the thermal energy does not suffice to overcome the magnetic anisotropy of nanophase magnetite.
Appendix B Composition of the tempered material probed by Mössbauer spectroscopy
Figure B.1 shows the Mössbauer spectra for the samples tempered at 1400 K. In comparison to the untreated sample, only iron-bearing silicates are detectable through Mössbauer spectroscopy, recognised by the absence of a Fe3 O4 SPM doublet and ferrimagnetic sextets as well as by a sextet structure induced by kamacite. Instead, spectra above the Néel temperature TN of olivine are composed only of two paramagnetic doublets representing olivine and pyroxene (bottom and middle panels). At 4.3 K (Fig. B.1, top panel) a big fraction of olivine has transitioned to the AFM state. Comparing the fraction of paramagnetic to anti-ferromagnetic olivine for the different heating temperatures, a decrease in paramagnetic olivine at liquid helium temperature with higher TH is observable (not shown here). As the Néel temperature TN increases with x in ![Mathematical equation: ${[\textrm{Mg}_{1-{x}}\textrm{Fe}_{x}]_2\textrm{SiO}_4}$](/articles/aa/full_html/2020/06/aa38120-20/aa38120-20-eq17.png) , this could indicate an enrichment of olivines present with iron and could possibly be connected to the absence of magnetite in the heated samples.
, this could indicate an enrichment of olivines present with iron and could possibly be connected to the absence of magnetite in the heated samples.
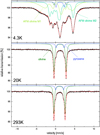 |
Fig. B.1 Mössbauer spectra of the sample heated at 1400 K measured at 4.3 K (top), 20 K (middle), and room temperature (bottom). Only iron-bearing silicates are detectable. |
References
- Barb, D. 1980, Grundlagen und Anwendungen der Mössbauerspektroskopie (Berlin: Akademie-Verlag) [Google Scholar]
- Belley, F., Ferré, E. C., Martín-Hernández, F., et al. 2009, Earth Planet. Sci. Lett., 284, 516 [NASA ADS] [CrossRef] [Google Scholar]
- Blum, J., & Wurm, G. 2008, ARA&A, 46, 21 [NASA ADS] [CrossRef] [EDP Sciences] [Google Scholar]
- Bogdan, T., Teiser, J., Fischer, N., Kruss, M., & Wurm, G. 2019, Icarus, 319, 133 [NASA ADS] [CrossRef] [Google Scholar]
- Braukmüller, N., Wombacher, F., Hezel, D. C., Escoube, R., & Münker, C. 2018, Geochim. Cosmochim. Acta, 239, 17 [NASA ADS] [CrossRef] [Google Scholar]
- Cadogan, J. M., & Devlin, E. J. 2012, Hyperfine Interact., 208, 91 [CrossRef] [Google Scholar]
- de Beule, C., Landers, J., Salamon, S., Wende, H., & Wurm, G. 2017, ApJ, 837, 59 [NASA ADS] [CrossRef] [Google Scholar]
- Demirci, T., Teiser, J., Steinpilz, T., et al. 2017, ApJ, 846, 48 [NASA ADS] [CrossRef] [Google Scholar]
- Demirci, T., Krause, C., Teiser, J., & Wurm, G. 2019, A&A, 629, A66 [NASA ADS] [CrossRef] [EDP Sciences] [Google Scholar]
- de Oliveria, J. C., da Costa, M. I., Schreiner, W. H., & Vasquez, A. 1991, J. Magn. Magn. Mater., 98, 239 [CrossRef] [Google Scholar]
- Dominik, C., & Tielens, A. G. G. M. 1997, ApJ, 480, 647 [NASA ADS] [CrossRef] [Google Scholar]
- Dyar, M. D., Agresti, D. G., Schaefer, M. W., Grant, C. A., & Sklute, E. C. 2006, Ann. Rev. Earth Planet. Sci., 34, 83 [CrossRef] [Google Scholar]
- Flock, M., Turner, N. J., Mulders, G. D., et al. 2019, A&A, 630, A147 [NASA ADS] [CrossRef] [EDP Sciences] [Google Scholar]
- Gärtner, S., Gundlach, B., Headen, T. F., et al. 2017, ApJ, 848, 96 [CrossRef] [Google Scholar]
- Goya, G. F., Berquó, T. S., Fonseca, F. C., & Morales, M. P. 2003, J. Appl. Phys., 94, 3520 [CrossRef] [Google Scholar]
- Grandjean, F., Long, G. J., Hautot, D., & Whitney, D. L. 1998, Hyperfine Interact., 116, 105 [CrossRef] [Google Scholar]
- Gundlach, B., Schmidt, K. P., Kreuzig, C., et al. 2018, MNRAS, 479, 1273 [NASA ADS] [CrossRef] [Google Scholar]
- Häggström, L., Kamali, S., Ericsson, T., et al. 2008, Hyperfine Interactions, 183, 49 [CrossRef] [Google Scholar]
- Heim, L.-O., Blum, J., Preuss, M., & Butt, H.-J. 1999, Phys. Rev. Lett., 83, 3328 [NASA ADS] [CrossRef] [Google Scholar]
- Hoye, G. S., & O’Reilly, W. 1972, J. Phys. Chem. Solids, 33, 1827 [CrossRef] [Google Scholar]
- Hsu, L. C. 1967, J. Geophys. Res., 72, 4235 [CrossRef] [Google Scholar]
- Johansen, A., Blum, J., Tanaka, H., et al. 2014, Protostars and Planets VI (Tucson: University of Arizona Press), 547 [Google Scholar]
- Johnson, K. L., Kendall, K., Roberts, A. D., & Tabor, D. 1971, Proc. R. Soc. London A. Math. Phys. Sci., 324, 301 [Google Scholar]
- Kataoka, A., Tanaka, H., Okuzumi, S., & Wada, K. 2013, A&A, 557, L4 [NASA ADS] [CrossRef] [EDP Sciences] [Google Scholar]
- Kimura, H., Senshu, H., & Wada, K. 2014, Planet. Space Sci., 100, 64 [CrossRef] [Google Scholar]
- Kimura, H., Wada, K., Senshu, H., & Kobayashi, H. 2015, ApJ, 812, 67 [NASA ADS] [CrossRef] [Google Scholar]
- Klima, R. L., Pieters, C. M., & Dyar, M. D. 2007, Meteorit. Planet. Sci., 42, 235 [Google Scholar]
- Kuzmann, E., Nagy, S., & Vértes, A. 2003, Pure Appl. Chem., 75, 801 [CrossRef] [Google Scholar]
- Landers, J., Salamon, S., Remmer, H., Ludwig, F., & Wende, H. 2016, Nano Lett., 16, 1150 [CrossRef] [Google Scholar]
- Lecar, M., Podolak, M., Sasselov, D., & Chiang, E. 2006, ApJ, 640, 1115 [Google Scholar]
- Lottermoser, W., Forcher, K., Amthauer, G., & Fuess, H. 1995, Phys. Chem. Miner., 22, 259 [CrossRef] [Google Scholar]
- Lyubutin, I. S., Lin, C. R., Korzhetskiy, Y. V., Dmitrieva, T. V., & Chiang, R. K. 2009, J. Appl. Phys., 106, 034311 [CrossRef] [Google Scholar]
- McClure, M. K., D’Alessio, P., Calvet, N., et al. 2013, ApJ, 775, 114 [NASA ADS] [CrossRef] [Google Scholar]
- Meisner, T., Wurm, G., & Teiser, J. 2012, A&A, 544, A138 [NASA ADS] [CrossRef] [EDP Sciences] [Google Scholar]
- Menzies, O. N., Bland, P. A., Berry, F. J., & Cressey, G. 2005, Meteorit. Planet. Sci., 40, 1023 [CrossRef] [Google Scholar]
- Morbidelli, A., Bitsch, B., Crida, A., et al. 2016, Icarus, 267, 368 [NASA ADS] [CrossRef] [Google Scholar]
- Morbidelli, A., Libourel, G., Palme, H., Jacobson, S. A., & Rubie, D. C. 2020, Earth Planet. Sci. Lett., 538, 116220 [CrossRef] [Google Scholar]
- Musiolik, G., & Wurm, G. 2019, ApJ, 873, 58 [NASA ADS] [CrossRef] [Google Scholar]
- Musiolik, G., Kruss, M., Demirci, T., et al. 2018, Icarus, 306, 25 [CrossRef] [Google Scholar]
- Ohtani, E., & Kumazawa, M. 1981, Phys. Earth Planet. Inter., 27, 32 [CrossRef] [Google Scholar]
- Omura, T., & Nakamura, A. M. 2017, Planet. Space Sci., 149, 14 [CrossRef] [Google Scholar]
- Oshtrakh, M. I., Petrova, E. V., Grokhovsky, V. I., & Semionkin, V. A. 2008, Hyperfine Interact., 186, 61 [CrossRef] [Google Scholar]
- Parks, G. A. 1984, J. Geophys. Res. Solid Earth, 89, 3997 [CrossRef] [Google Scholar]
- Preston, R. S., Hanna, S. S., & Heberle, J. 1962, Phys. Rev., 128, 2207 [CrossRef] [Google Scholar]
- Ros, K., Johansen, A., Riipinen, I., & Schlesinger, D. 2019, A&A, 629, A65 [NASA ADS] [CrossRef] [EDP Sciences] [Google Scholar]
- Rumpf, H. C. H. 1970, Chemie Ingenieur Technik, 42, 538 [CrossRef] [Google Scholar]
- Scott, E. R. D., & Krot, A. N. 2014, Chondrites and Their Components, ed. A. M. Davis (Amsterdam: Elsevier), 1, 65 [Google Scholar]
- Sklute, E. C. 2006, PhD thesis, Mount Holyoke College, South Hadley, USA [Google Scholar]
- Steinpilz, T., Teiser, J., & Wurm, G. 2019, ApJ, 874, 60 [NASA ADS] [CrossRef] [Google Scholar]
- Vericel, A., & Gonzalez, J.-F. 2020, MNRAS, 492, 210 [NASA ADS] [CrossRef] [Google Scholar]
- von Hörsten, U. 2019, Pi Program Package, https://www.uni-due.de/~hm236ap/hoersten/home.html [Google Scholar]
- Weidenschilling, S. J. 1977, MNRAS, 180, 57 [NASA ADS] [CrossRef] [Google Scholar]
- Weisberg, M. K., McCoy, T. J., & Krot, A. N. 2006, Systematics and Evaluation of Meteorite Classification, eds. D. S. Lauretta, & H. Y. McSween Tucson: University of Arizona Press, 19 [Google Scholar]
- Yamamoto, T., Kadono, T., & Wada, K. 2014, ApJ, 783, L36 [NASA ADS] [CrossRef] [Google Scholar]
- Youdin, A. N., & Goodman, J. 2005, ApJ, 620, 459 [NASA ADS] [CrossRef] [Google Scholar]
- Zhiganova, E. V., Grokhovsky, V. I., & Oshtrakh, M. I. 2007, Phys. Status Solidi A Appl. Mater. Sci., 204, 1185 [CrossRef] [Google Scholar]
All Tables
Mössbauer parameters of all iron-bearing phases identified in the spectrum of the unheated sample measured at room temperature.
All Figures
|
Fig. 1 Grain size distribution (volume fraction) for tempered samples. Two examples for sizes below 1250 K (300 and 1000 K) are similar. At higher temperature the grain size shifts to larger sizes. The sample at 1400 K is dominated by large grains of 142 μm. |
| In the text | |
|
Fig. 2 Grain size evolution with temperature. The volume-averaged grain sizes (squares) and the number averaged grain sizes (triangles) are shown. A line indicates the mean diameter of 9.7 ± 2.5 μm for the temperature range from 300 to 1250 K based on the volume-averaged grain size. |
| In the text | |
|
Fig. 3 Evolution of the bulk density of the material calculated from the composition determined in Mössbauer measurements. |
| In the text | |
|
Fig. 4 Experimental set-up. By driving down the linear stage, the blade applies a force onto the cylindric sample until it breaks. The peak force is measured by a force sensor. |
| In the text | |
|
Fig. 5 Tensile strength σ over volume filling factor Φ for tempered samples. Power laws are fitted to the data according to Eq. (6). |
| In the text | |
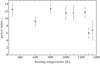 |
Fig. 6 Power indices a (see Eq. (6)) depending on heating temperature TH. |
| In the text | |
|
Fig. 7 Ratio of the surface energy at temperature T to that at room temperature (γe(T)∕γe(300 K)). Typical error bars are of the order of 5%. The line is a linear trend fitted to the data up to 1250 K. Error bars for the two highest temperatures are due to volume filling factor dependent differences in contact force or effective surface energy. |
| In the text | |
|
Fig. 8 Top panel: relative spectral area of the contribution of each mineral to the fit. Bottom panel: weight percentages of all minerals obtained through their relative spectral areas. |
| In the text | |
|
Fig. 9 Fraction of SPM Fe3O4 doublet area compared to the total Fe3O4 contribution for the untreated dust sample and three different heating temperatures TH. The dashed lines serve as a guide to the eye. |
| In the text | |
|
Fig. A.1 Mössbauer spectra of the unheated sample measured at 4.3 K (top), 20 K (middle), and room temperature (bottom). Contributions from various iron-bearing phases are tagged. |
| In the text | |
|
Fig. B.1 Mössbauer spectra of the sample heated at 1400 K measured at 4.3 K (top), 20 K (middle), and room temperature (bottom). Only iron-bearing silicates are detectable. |
| In the text | |
Current usage metrics show cumulative count of Article Views (full-text article views including HTML views, PDF and ePub downloads, according to the available data) and Abstracts Views on Vision4Press platform.
Data correspond to usage on the plateform after 2015. The current usage metrics is available 48-96 hours after online publication and is updated daily on week days.
Initial download of the metrics may take a while.