Fig. 8.
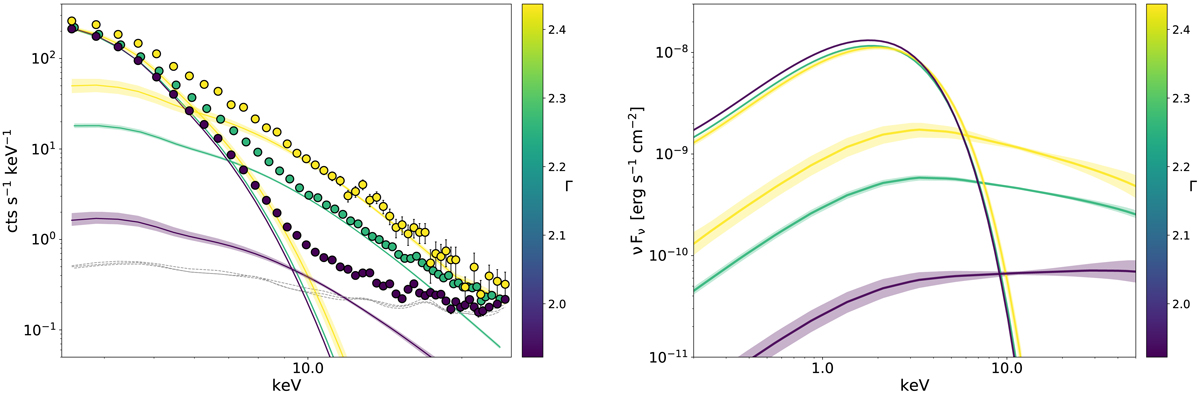
Examples of observed spectra with best-fit models (left, including background, shown with a grey-dashed line) and modelled spectral energy distributions (right, without background) of three states, selected taking the 10th, 50th, and 90th percentile of log Fcor in a narrow range of Fdisc (namely around a ±0.05 dex of the median log Fdisc). Both data and models are colour-coded with the fit Γ, highlighting a softer-when-brighter trend in log Fcor. These three states are represented by red-contour data points in the bottom panel of Fig. 7.
Current usage metrics show cumulative count of Article Views (full-text article views including HTML views, PDF and ePub downloads, according to the available data) and Abstracts Views on Vision4Press platform.
Data correspond to usage on the plateform after 2015. The current usage metrics is available 48-96 hours after online publication and is updated daily on week days.
Initial download of the metrics may take a while.