Fig. 5.
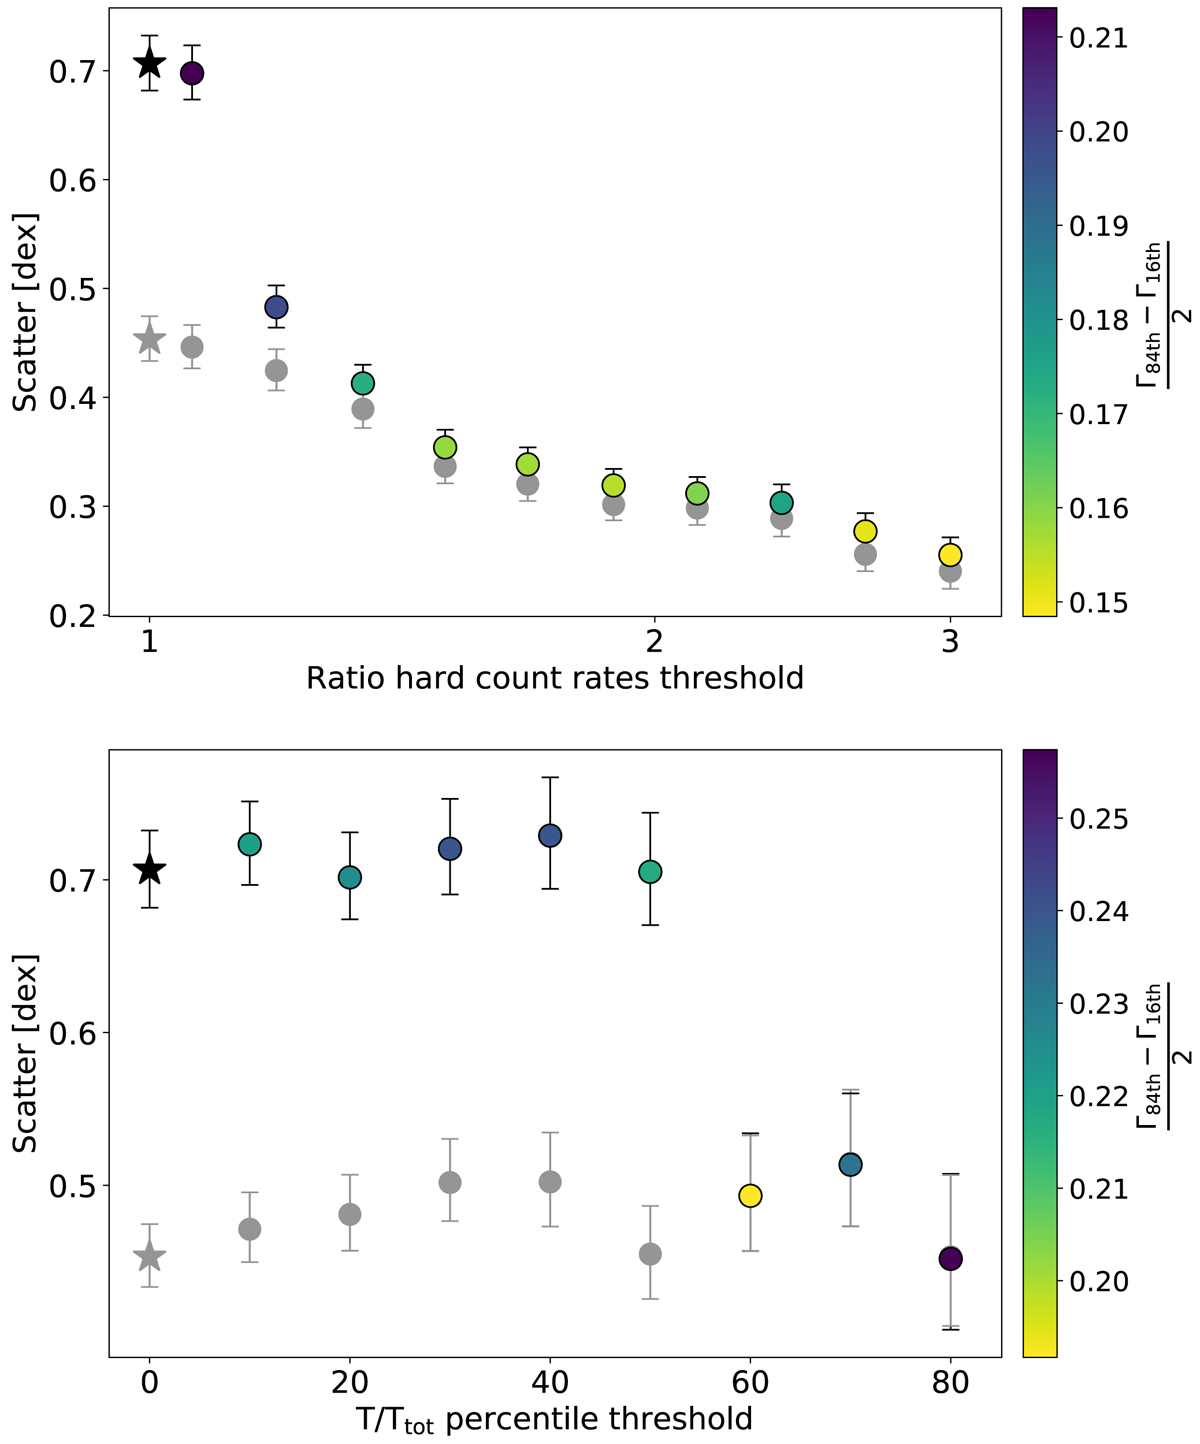
Top panel: scatter of the Fdisc − Fcor relation as a function of a cut in the ratio between the total (source plus background) and background-only 10 − 25 keV count rates. Coloured points are relative to the full sample and coded with the 16th–84th interquantile range in the related Γ distributions, whereas grey points are obtained excluding SS10. Stars correspond to the starting sample with no filters. Bottom panel: scatter as a function of a cut in the fraction of time spent by GX 339–4 in a region of the outburst, including SSs and SIMSs only (see Sect. 4.2 for a detailed description). Colour coding and symbols are the same as in the top panel.
Current usage metrics show cumulative count of Article Views (full-text article views including HTML views, PDF and ePub downloads, according to the available data) and Abstracts Views on Vision4Press platform.
Data correspond to usage on the plateform after 2015. The current usage metrics is available 48-96 hours after online publication and is updated daily on week days.
Initial download of the metrics may take a while.