Fig. 4.
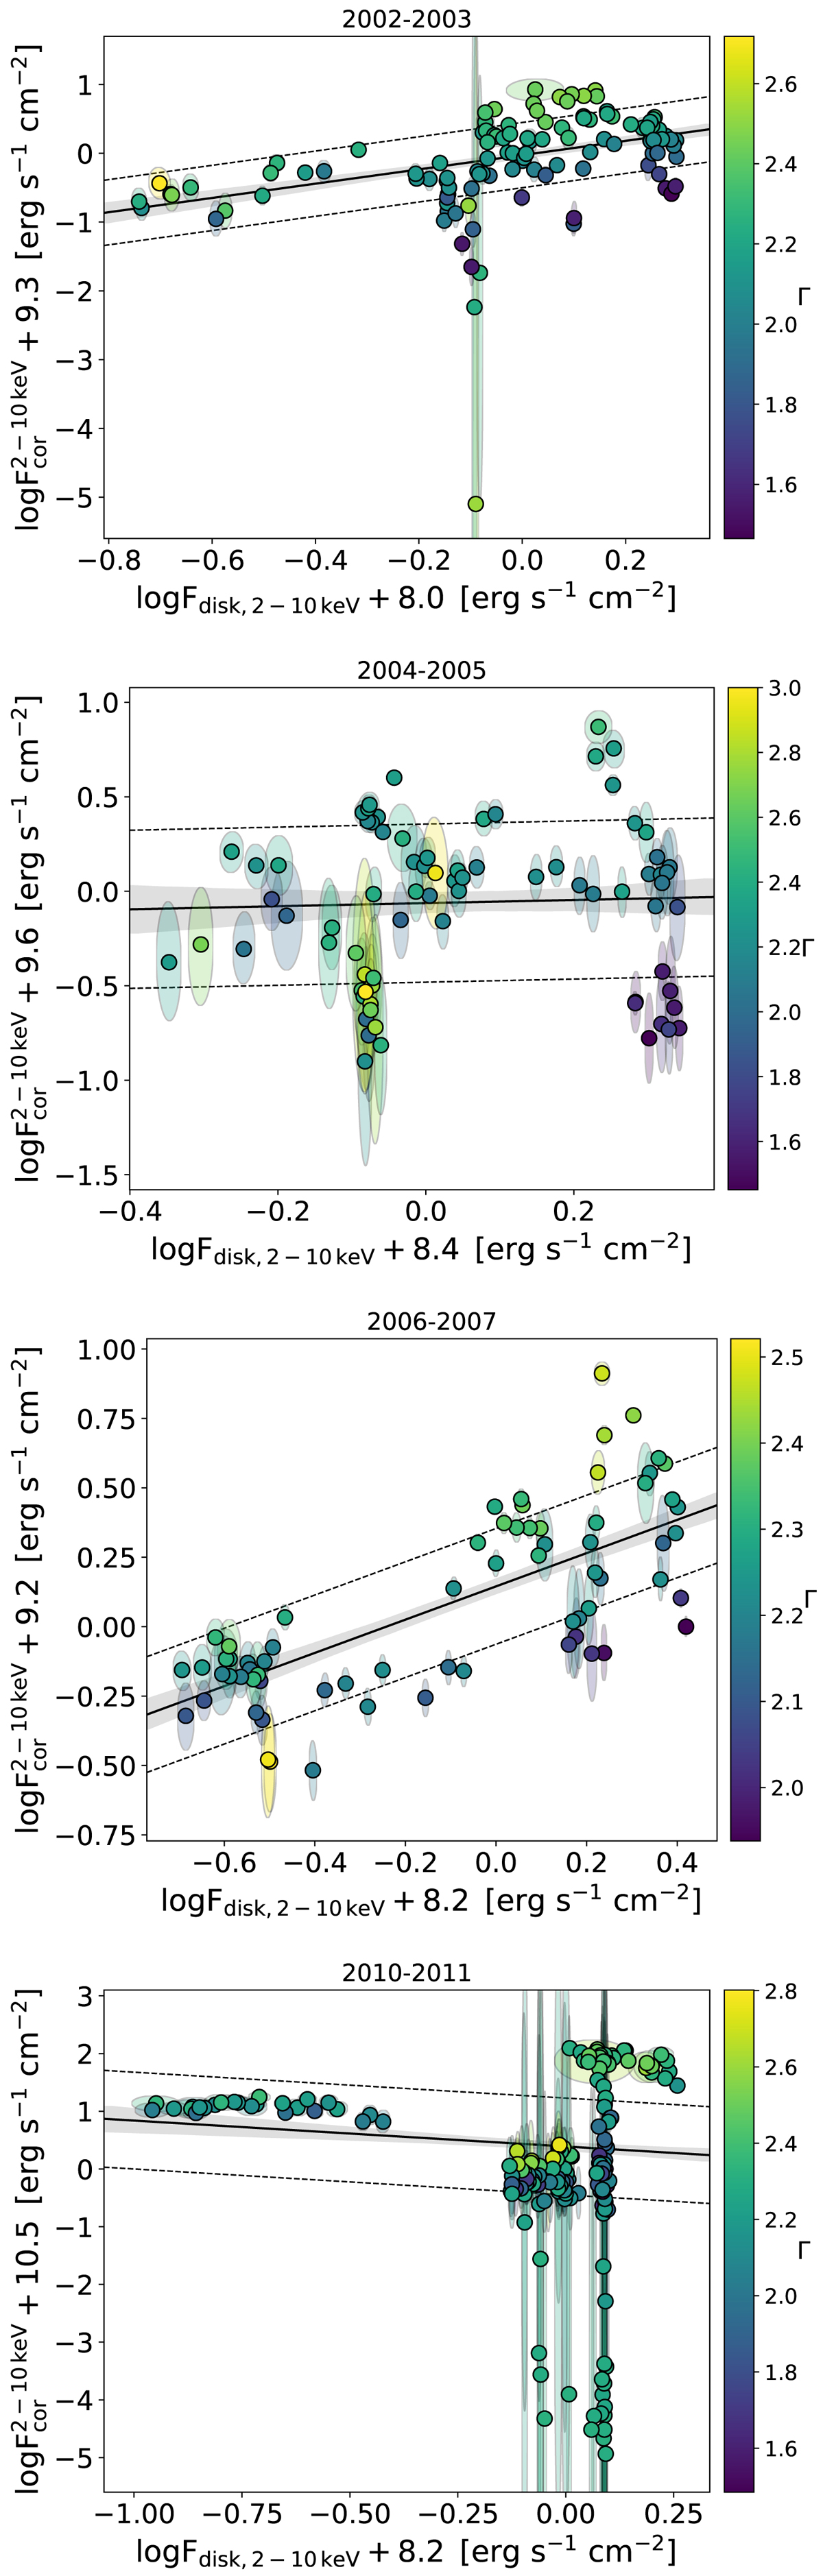
Fdisc − Fcor plane for SS02, SS04, SS07, and SS10 (from top to bottom), with fluxes scaled with their median value. As uncertainties, we report 3σ contours of the 2D distribution of fluxes from the posterior chains, shown with ellipsoids. The solid black line is the median regression line obtained with emcee, with the corresponding 16th and 84th percentiles represented with the shaded grey area. The dashed black lines show the fit scatter around the median relation.
Current usage metrics show cumulative count of Article Views (full-text article views including HTML views, PDF and ePub downloads, according to the available data) and Abstracts Views on Vision4Press platform.
Data correspond to usage on the plateform after 2015. The current usage metrics is available 48-96 hours after online publication and is updated daily on week days.
Initial download of the metrics may take a while.