Fig. 3.
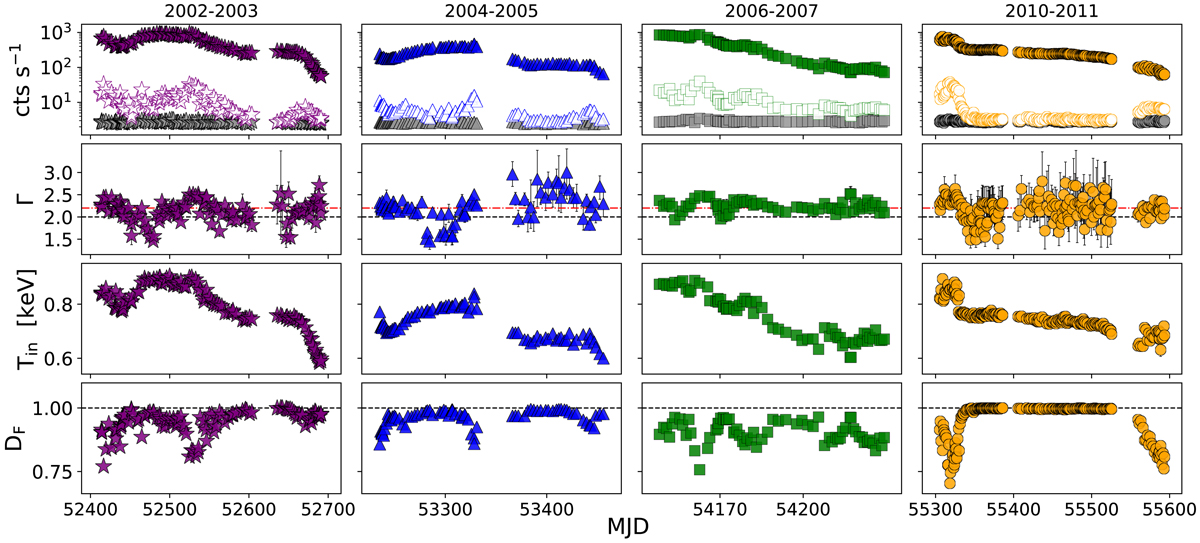
Evolution of the 3 − 25 keV count rate, of the fit photon index and disc temperature, and of the disc fraction DF (see Eq. (1)) is shown along the four different outbursts (same colour coding and symbols as in Fig. 1). Top panels: filled coloured symbols represent the total (source plus background) 3 − 25 keV count rates, the coloured empty symbols the total count rates in the 10 − 25 keV band, and the grey symbols the background count rates in the 10 − 25 keV band. Middle-top panel: a black dashed line at Γ = 2 is shown to guide the eye, whereas the red dot-dashed line highlights the median Γ = 2.20 of the whole XRB sample used in Sect. 5.
Current usage metrics show cumulative count of Article Views (full-text article views including HTML views, PDF and ePub downloads, according to the available data) and Abstracts Views on Vision4Press platform.
Data correspond to usage on the plateform after 2015. The current usage metrics is available 48-96 hours after online publication and is updated daily on week days.
Initial download of the metrics may take a while.