Fig. 2.
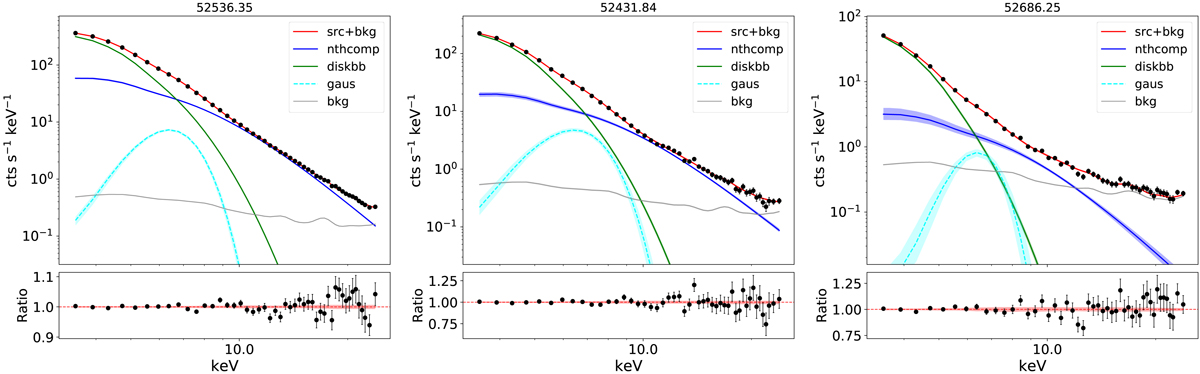
Three examples of source plus background spectra (black dots, error bars included), with related data–model ratios in the lower panels. The three observations were selected taking the 84th percentile, median, and 16th percentile of the total 3 − 25 keV flux distribution of the full XRB sample used in Sect. 5, shown from left to right respectively. These correspond to the three larger black symbols in Fig. 1, going downwards in the q-plot. All additive model components are shown and defined in the legend, with the total source plus background model shown in red. For each component, the solid lines represent the median of the model distribution computed from the posteriors of the fit parameters (with 16th–84th percentile coloured contours around them, in some cases smaller than the thickness of the line).
Current usage metrics show cumulative count of Article Views (full-text article views including HTML views, PDF and ePub downloads, according to the available data) and Abstracts Views on Vision4Press platform.
Data correspond to usage on the plateform after 2015. The current usage metrics is available 48-96 hours after online publication and is updated daily on week days.
Initial download of the metrics may take a while.