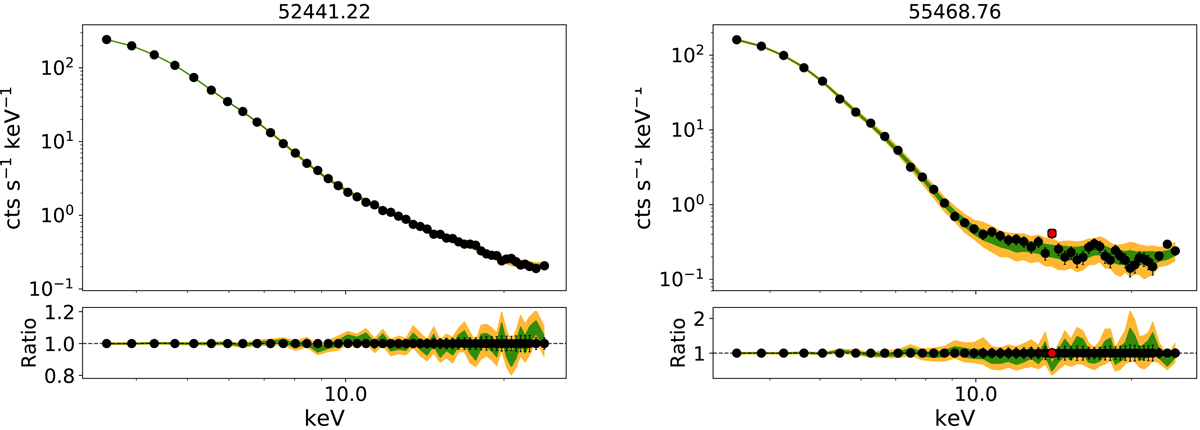
Fig. A.5.

Two examples of the posterior predictive check performed simulating 300 count rate spectra starting from the best-fit parameters posterior distributions. Data points are the actual spectrum, with green and orange contours as 16th−84th and 1st−99th interquantile ranges representing the predictive power of the spectral model. Energy bins in which the observed data point was not compatible within the 1st−99th interquantile range of the predicted spectra from the best-fit models are shown in red.
Current usage metrics show cumulative count of Article Views (full-text article views including HTML views, PDF and ePub downloads, according to the available data) and Abstracts Views on Vision4Press platform.
Data correspond to usage on the plateform after 2015. The current usage metrics is available 48-96 hours after online publication and is updated daily on week days.
Initial download of the metrics may take a while.


