Open Access
Fig. A.3.
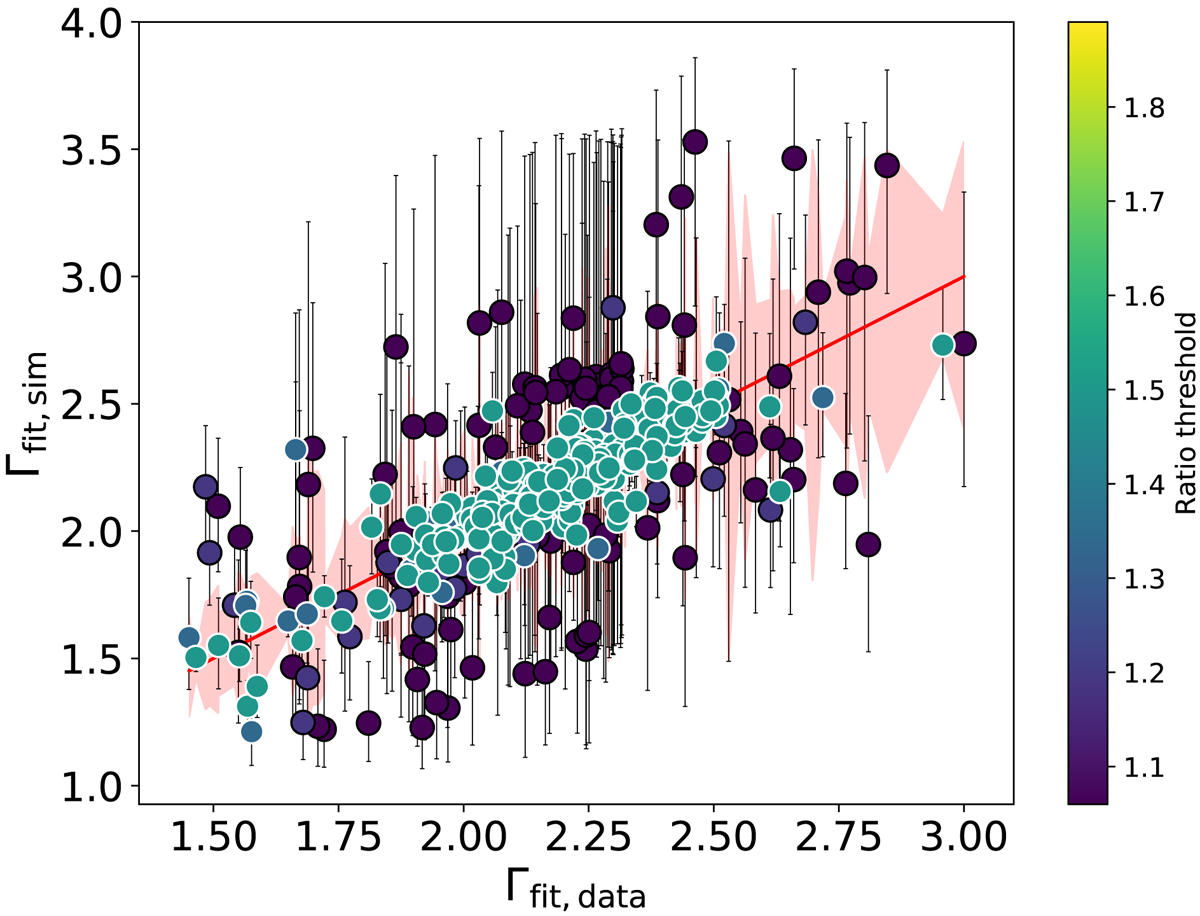
Same as Fig. A.1, but colour coded with the threshold on the ratio between the total (source plus background) and background-only 10 − 25 keV count rates. The one we adopted (i.e. ∼1.3) is shown with white contours on data points.
Current usage metrics show cumulative count of Article Views (full-text article views including HTML views, PDF and ePub downloads, according to the available data) and Abstracts Views on Vision4Press platform.
Data correspond to usage on the plateform after 2015. The current usage metrics is available 48-96 hours after online publication and is updated daily on week days.
Initial download of the metrics may take a while.