Fig. A.1.
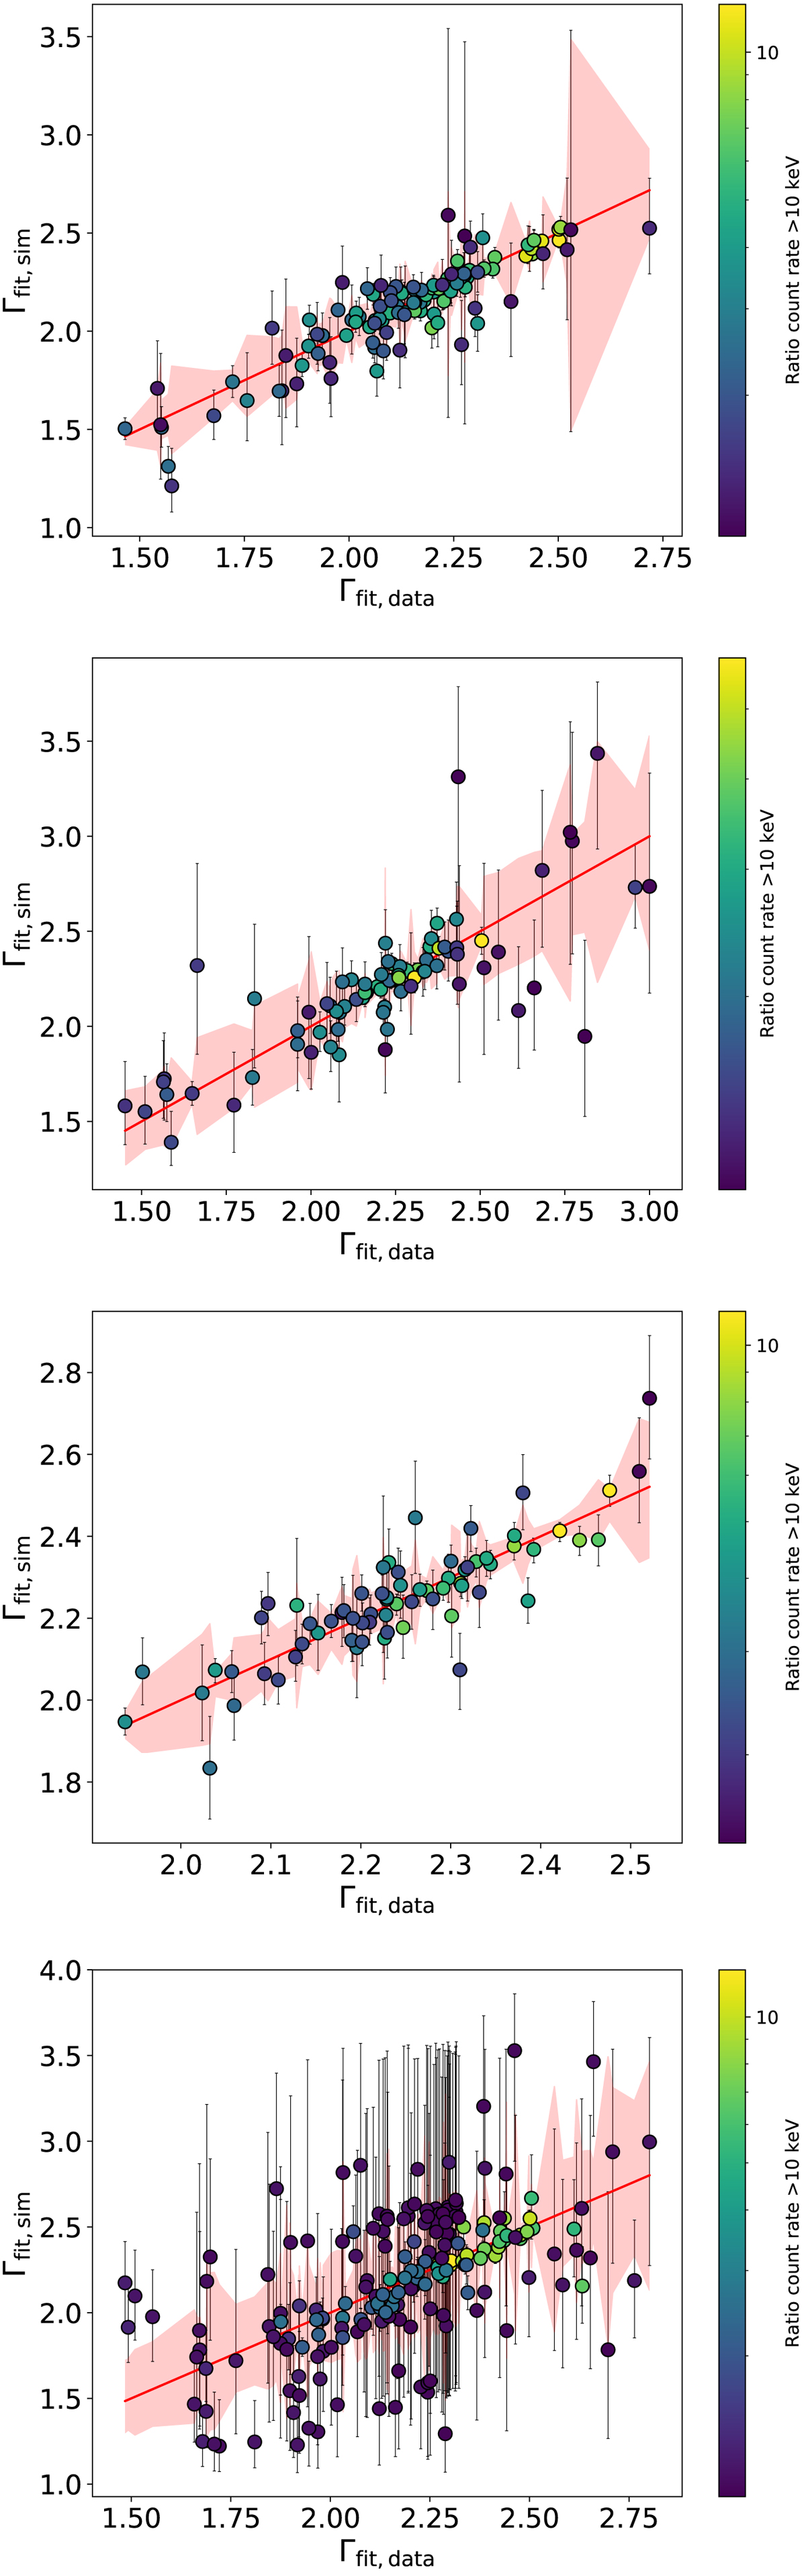
Comparison between the photon index obtained in the spectral fit (see Sect. 3.2; Γfit, data), which was then simulated and fit again (Γfit, simul). From top to bottom: results for SS02, SS04, SS07, and SS10 are shown. Error bars for Γfit, simul are shown (16th−84th percentiles), whereas we show uncertainties (16th−84th percentiles) in Γfit, data around the 1:1 relation. We colour coded data with the ratio between the total (source plus background) and background-only 10 − 25 keV count rates (see white and grey symbols in the top panel of Fig. 3).
Current usage metrics show cumulative count of Article Views (full-text article views including HTML views, PDF and ePub downloads, according to the available data) and Abstracts Views on Vision4Press platform.
Data correspond to usage on the plateform after 2015. The current usage metrics is available 48-96 hours after online publication and is updated daily on week days.
Initial download of the metrics may take a while.