Fig. 11.
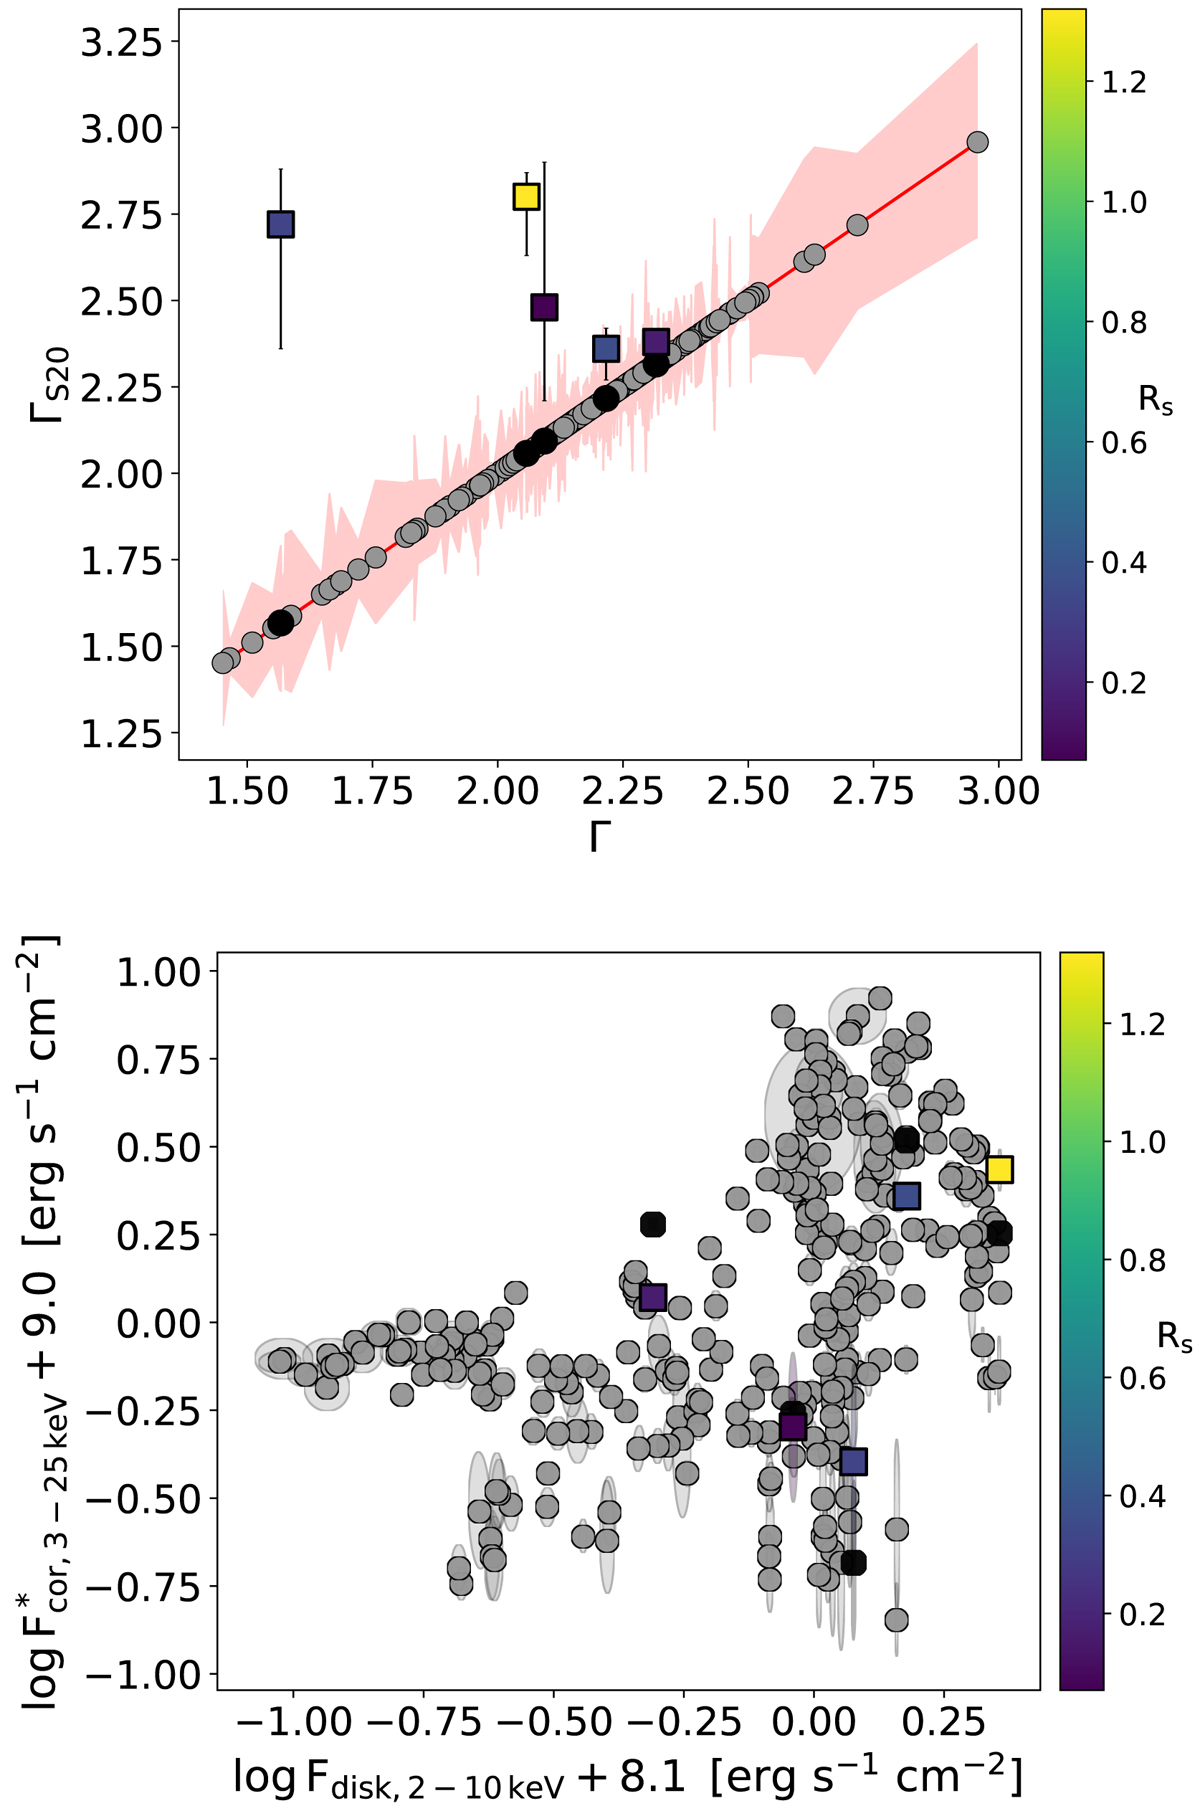
Top panel: comparison between our fit Γ (black circles) and the values obtained by Sridhar et al. (2020) for the five observations in common (squares, colour coded by the reflection strength as defined by Sridhar et al. 2020). The grey points with red contours refer to our whole sample. Bottom panel: similar comparison in the Ldisc − Lcor plane where we highlight the difference between our original Fcor, 3 − 25 keV (black circles) and the reflection-corrected ![]() obtained with the reflection strength estimates computed by Sridhar et al. (2020).
obtained with the reflection strength estimates computed by Sridhar et al. (2020).
Current usage metrics show cumulative count of Article Views (full-text article views including HTML views, PDF and ePub downloads, according to the available data) and Abstracts Views on Vision4Press platform.
Data correspond to usage on the plateform after 2015. The current usage metrics is available 48-96 hours after online publication and is updated daily on week days.
Initial download of the metrics may take a while.