Fig. 10.
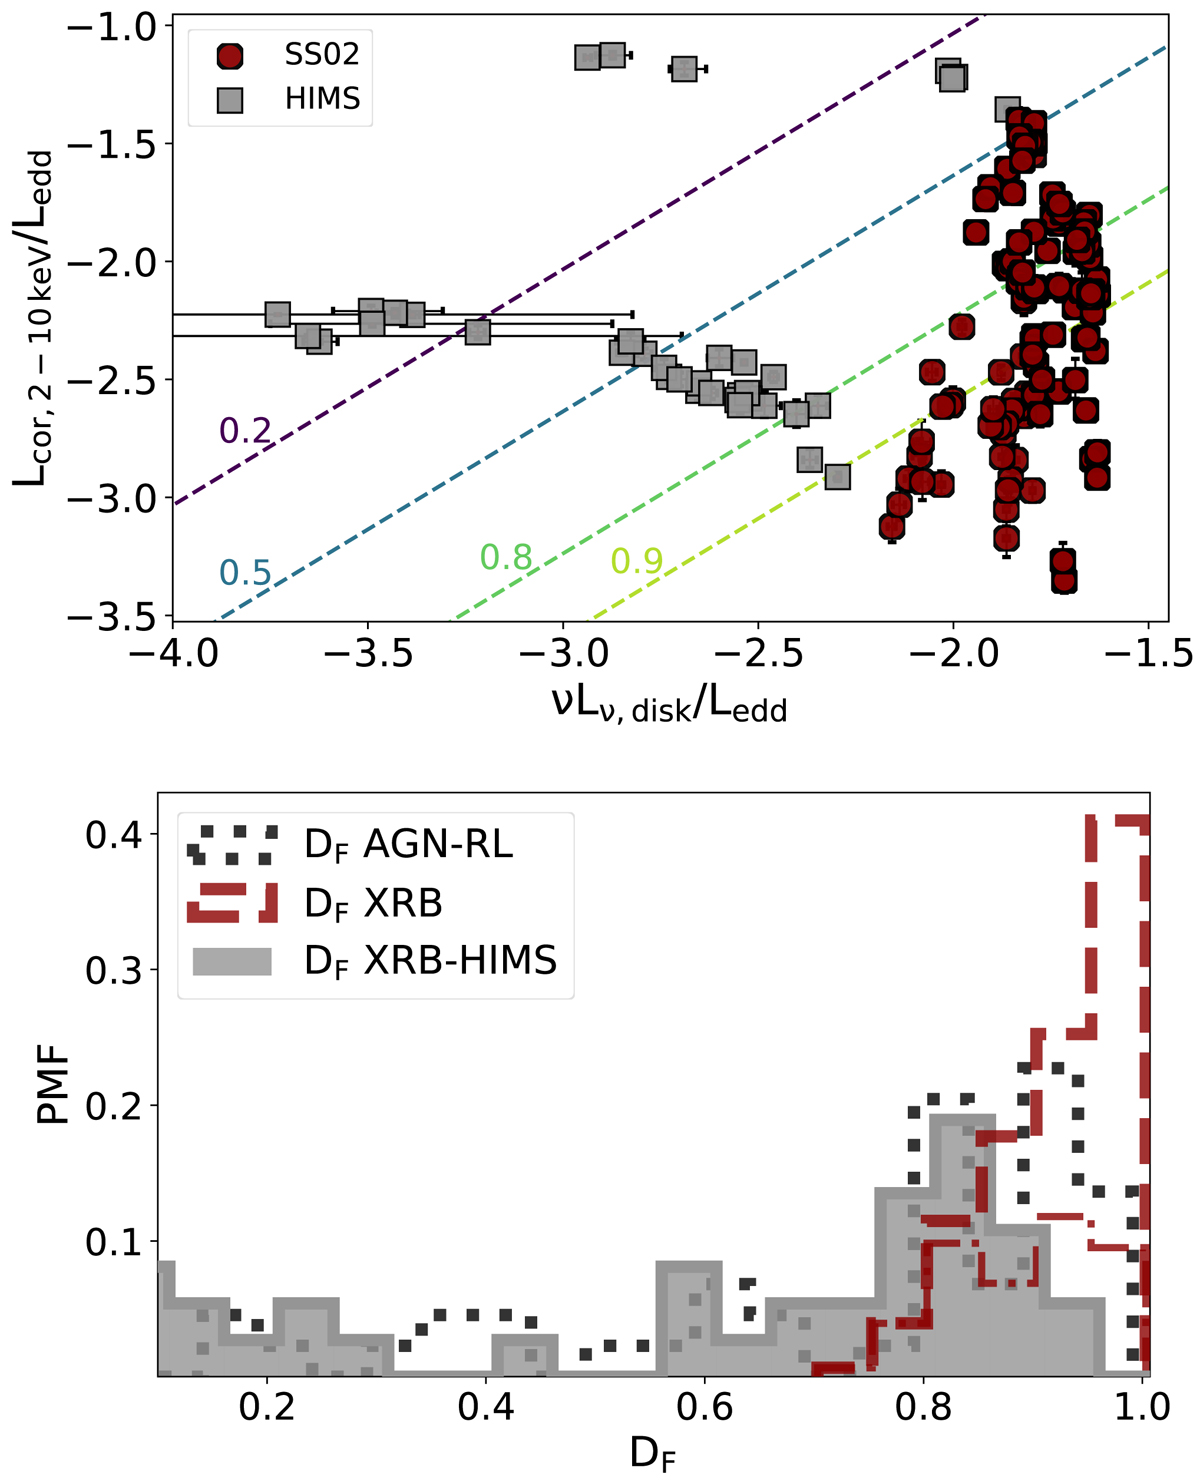
Top panel: same as the top-right panel of Fig. 9, with only the SSs and SIMSs of the 2002−2003 outburst (dark red circles, with SIMS highlighted by a thicker black contour) and its HIMSs (grey squares). Lines of approximately constant DF are shown with dashed lines, and the related values are shown in the figure. Bottom panel: same as the bottom left panel of Fig. 9, but with again the SS-SIMS (dark red dashed, with SIMS only highlighted by the dot-dashed line) and HIMS (grey) of the 2002−2003 outburst, plus the 44 radio-loud AGNs excluded from our AGN sample (black dotted line).
Current usage metrics show cumulative count of Article Views (full-text article views including HTML views, PDF and ePub downloads, according to the available data) and Abstracts Views on Vision4Press platform.
Data correspond to usage on the plateform after 2015. The current usage metrics is available 48-96 hours after online publication and is updated daily on week days.
Initial download of the metrics may take a while.