Free Access
Fig. 9
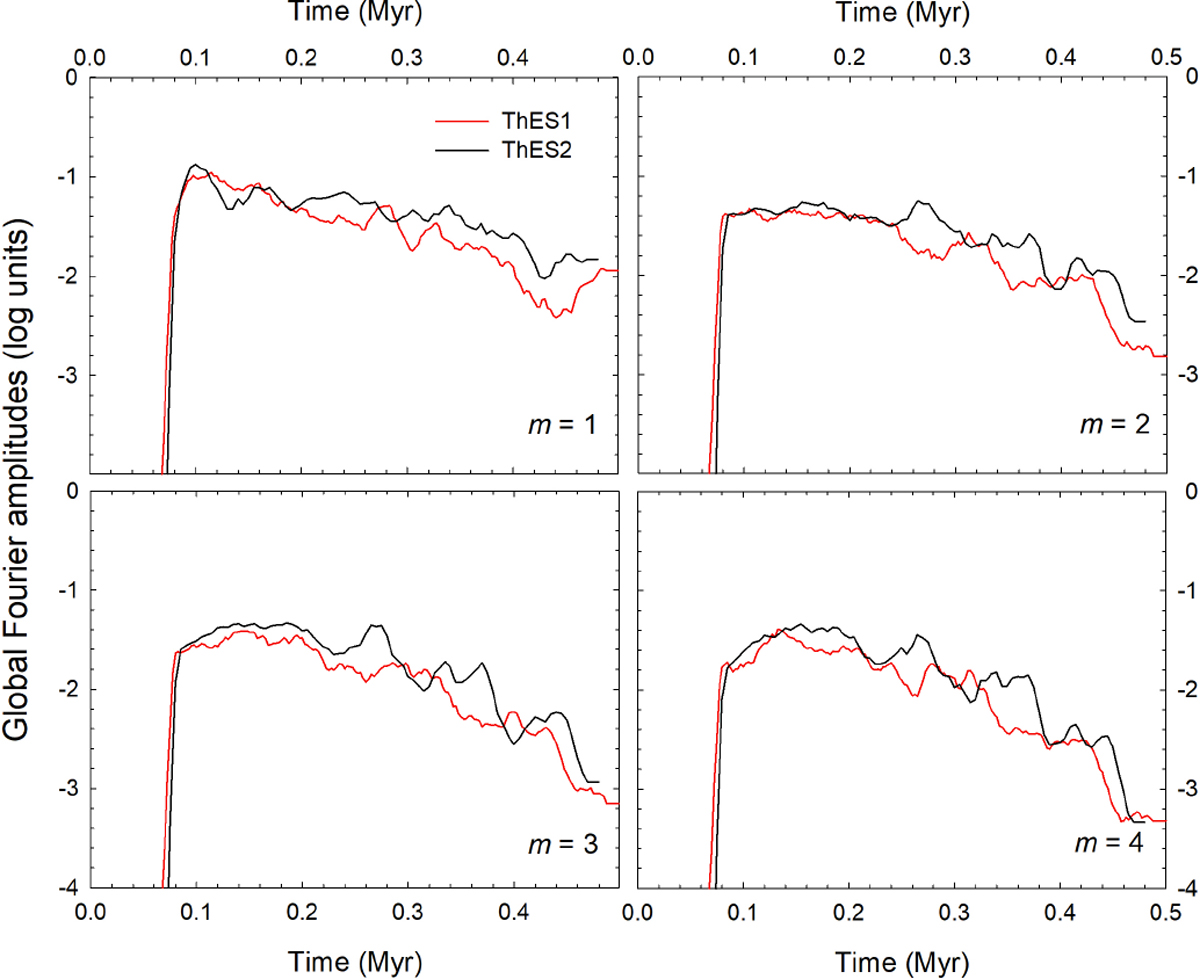
Comparison of the global Fourier amplitudes in model 2v with ThES1 (red lines) and ThES2 (black lines). The global amplitudes for four modes (m = 1, 2, 3, and 4) are shown in the four panels. The time is counted from the beginning of the core collapse.
Current usage metrics show cumulative count of Article Views (full-text article views including HTML views, PDF and ePub downloads, according to the available data) and Abstracts Views on Vision4Press platform.
Data correspond to usage on the plateform after 2015. The current usage metrics is available 48-96 hours after online publication and is updated daily on week days.
Initial download of the metrics may take a while.