Fig. 7
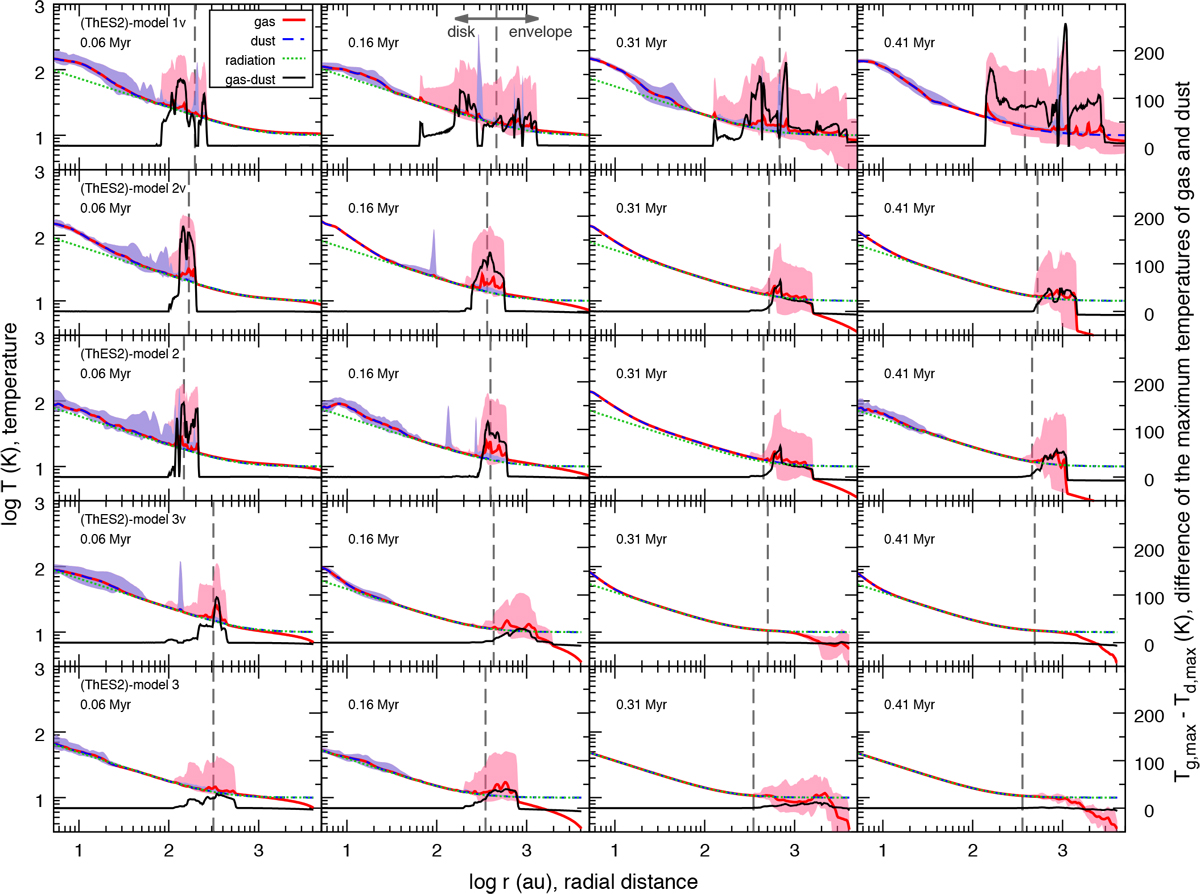
Azimuthally averaged radial distributions of temperatures for gas (red solid line), dust (blue dash-dotted line), and radiation (green dotted line) in five models considered. The shaded areas indicate the range of azimuthal variations of gas (pink) and dust (blue) temperatures at each radius. The black line is the difference between the maximum temperatures of gas and dust (right-hand axis). The gray dashed line shows the radius of the disk outer edge. The arrangement of panels is the same as in Fig. 1.
Current usage metrics show cumulative count of Article Views (full-text article views including HTML views, PDF and ePub downloads, according to the available data) and Abstracts Views on Vision4Press platform.
Data correspond to usage on the plateform after 2015. The current usage metrics is available 48-96 hours after online publication and is updated daily on week days.
Initial download of the metrics may take a while.