Fig. 5
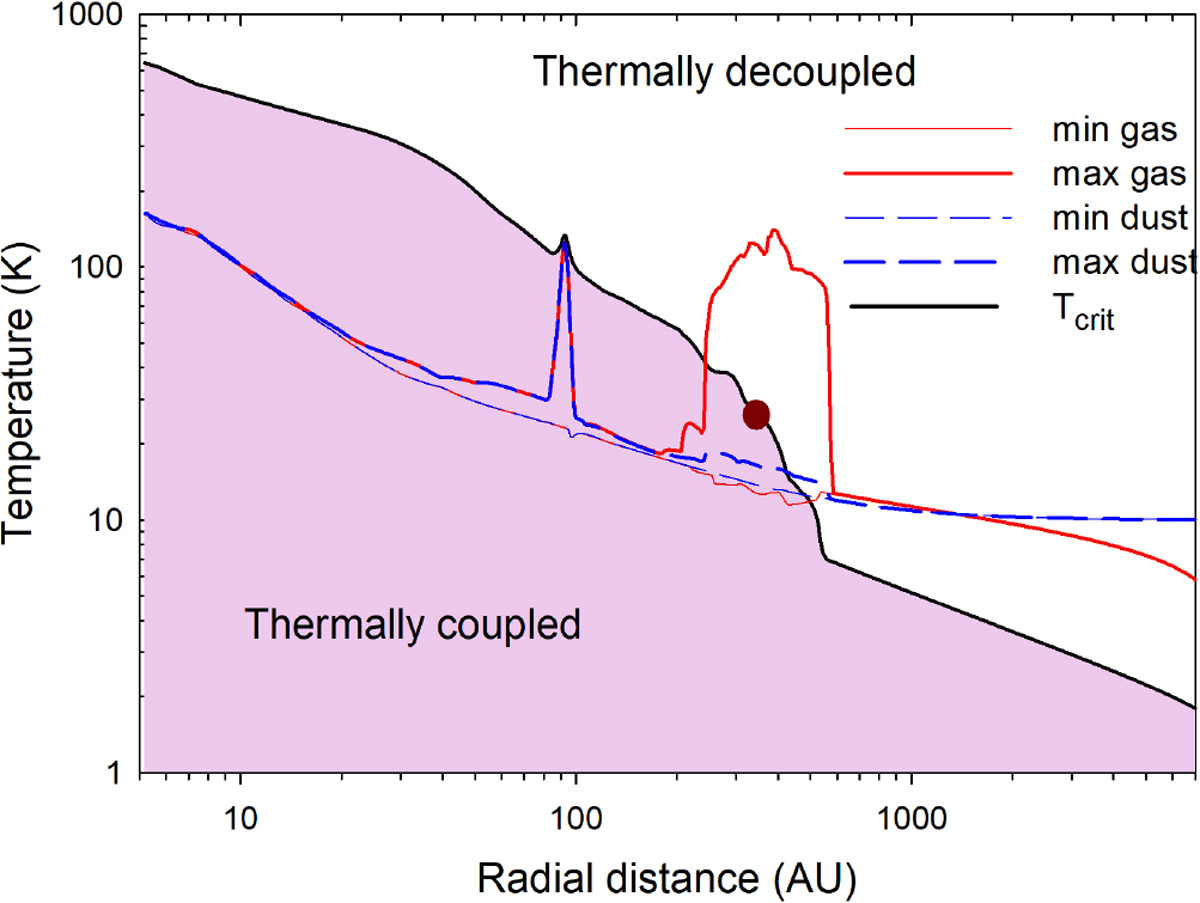
Decoupling of gas and dust temperatures in the disk and envelope in (ThES2)-model 2v at t = 0.16 Myr. Shown are the threshold temperature (Tcrit, black thick line) above and below which the gas and dust temperatures are thermally decoupled and coupled, respectively. The red thin and thick lines present the minimum and maximum azimuthal variations of the gas temperature, respectively,while the blue dashed thin and thick lines show the corresponding quantities for the dust temperature. The brown circleindicates the position of the disk outer edge.
Current usage metrics show cumulative count of Article Views (full-text article views including HTML views, PDF and ePub downloads, according to the available data) and Abstracts Views on Vision4Press platform.
Data correspond to usage on the plateform after 2015. The current usage metrics is available 48-96 hours after online publication and is updated daily on week days.
Initial download of the metrics may take a while.