Free Access
Fig. 21
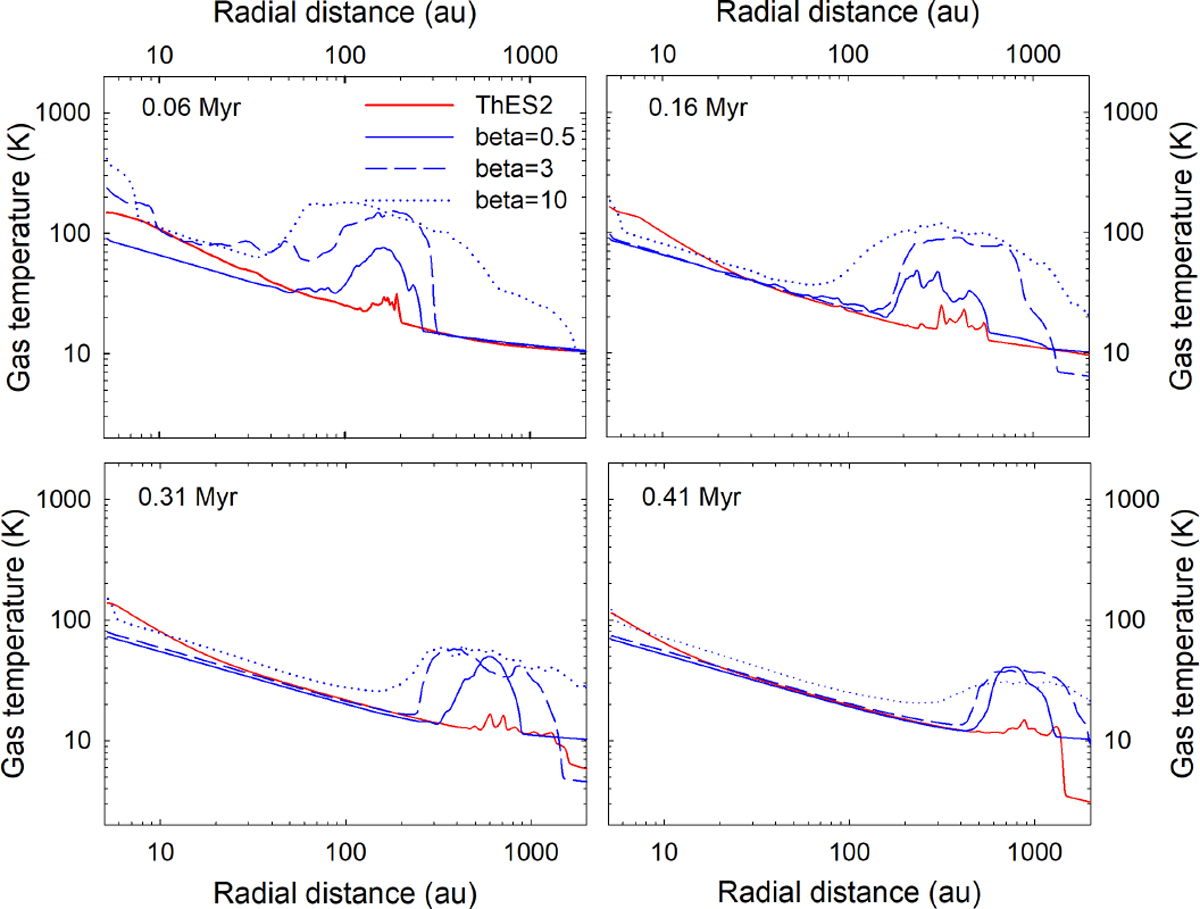
Comparison of the azimuthally averaged gas temperatures in (TheS2)-model 2v (red lines) and in β-models with irradiation. The blue solid, dashed, and dotted lines show the profiles for model 2v with β = 0.5, β = 3, and β = 10, respectively.
Current usage metrics show cumulative count of Article Views (full-text article views including HTML views, PDF and ePub downloads, according to the available data) and Abstracts Views on Vision4Press platform.
Data correspond to usage on the plateform after 2015. The current usage metrics is available 48-96 hours after online publication and is updated daily on week days.
Initial download of the metrics may take a while.