Fig. 19
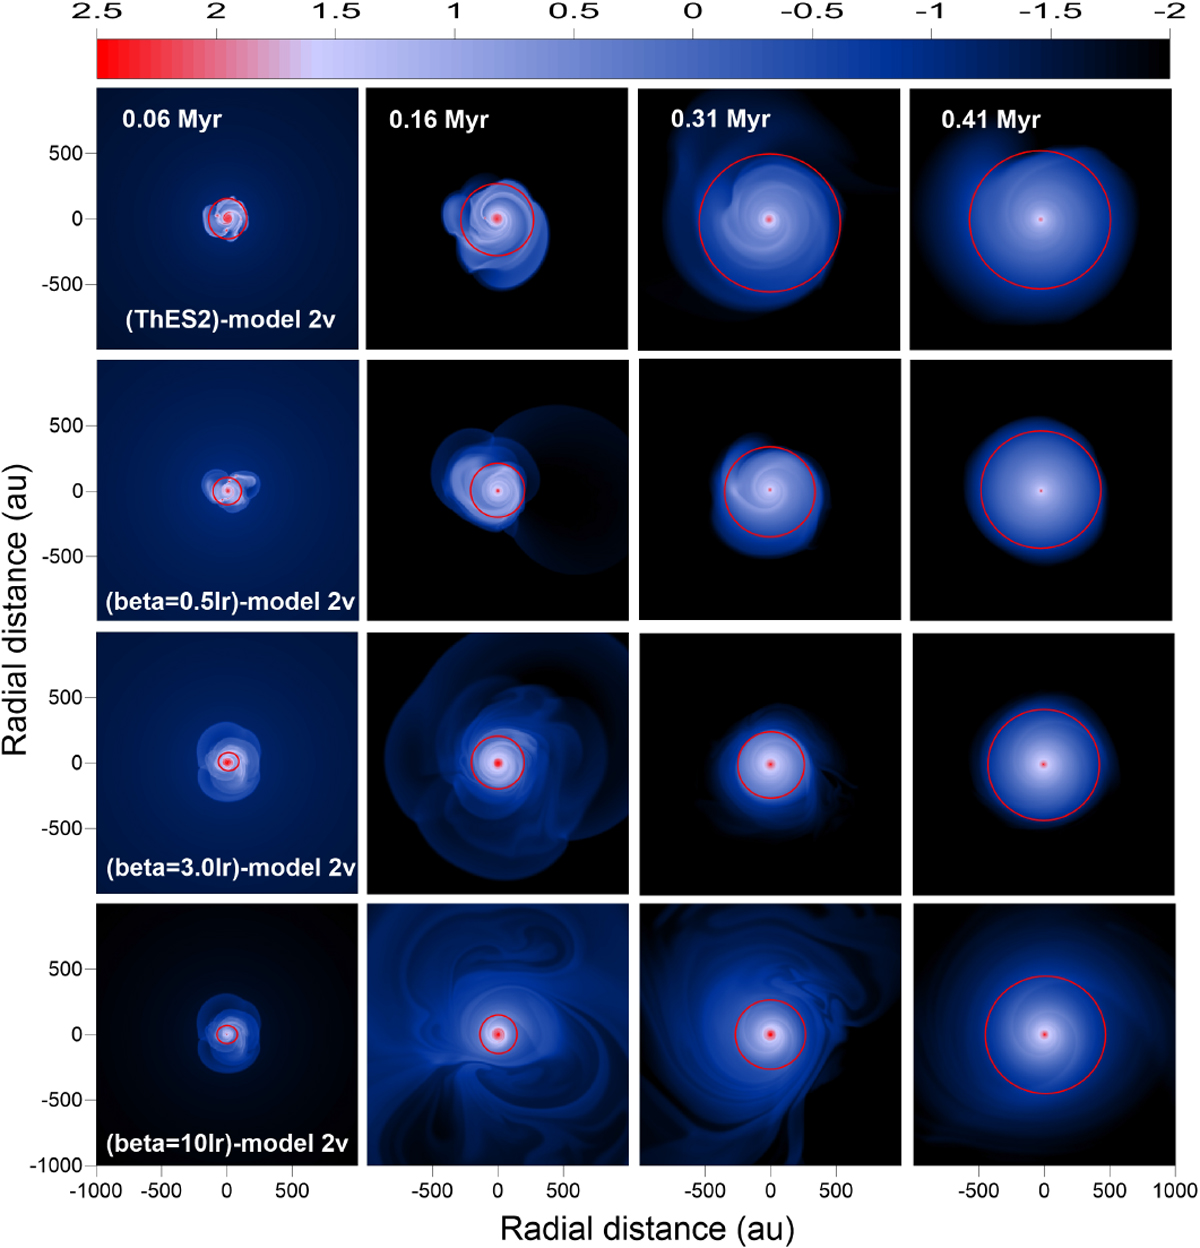
Comparison of gas surface density distributions in model v2 with ThES2 and in β-models that takestellar and background irradiation into account. First row: (ThES2)-model 2v, second row: (beta=0.5Ir)-model 2v, third row: (beta=3Ir)-model 2v, and bottom row: (beta=10Ir)-model 2v. The red circles outline the radial distance beyond which the azimuthally averaged angular velocity deviates from the Keplerian rotation bymore than 10%. The time is counted from the instance of disk formation. The scale bar is in log g cm−2.
Current usage metrics show cumulative count of Article Views (full-text article views including HTML views, PDF and ePub downloads, according to the available data) and Abstracts Views on Vision4Press platform.
Data correspond to usage on the plateform after 2015. The current usage metrics is available 48-96 hours after online publication and is updated daily on week days.
Initial download of the metrics may take a while.