Fig. 16
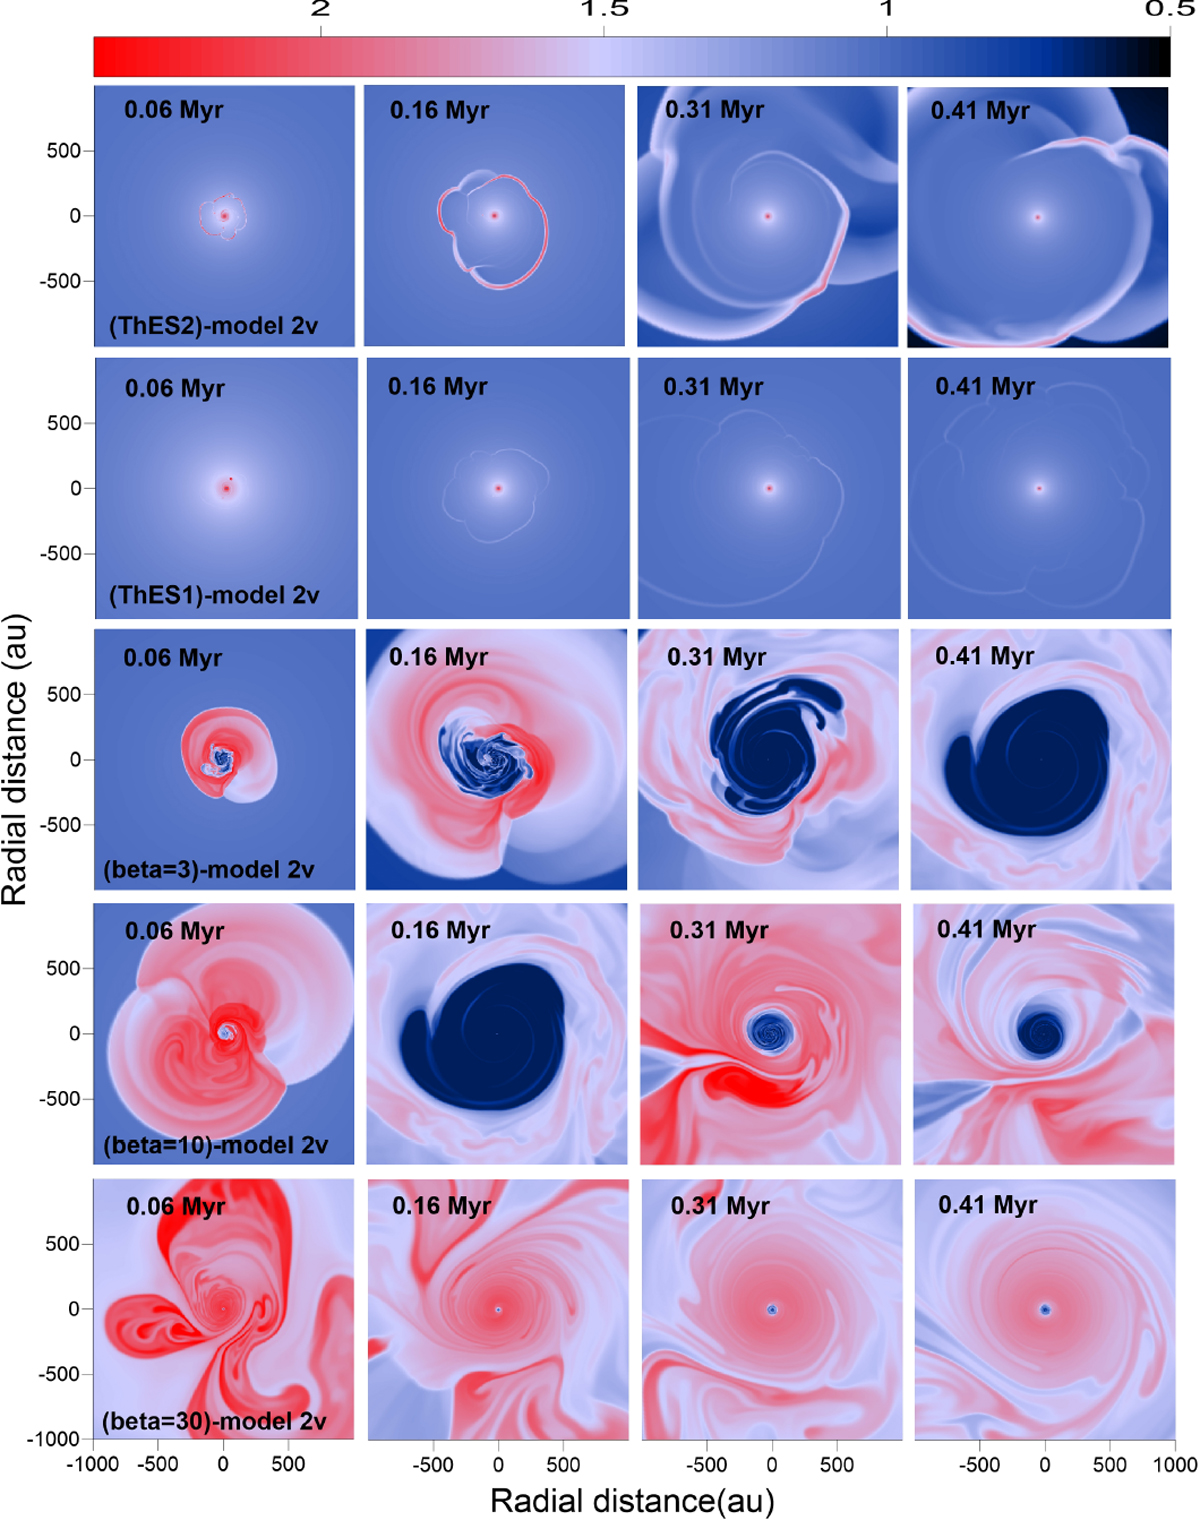
Comparison of gas temperature distributions in models with different thermal evolution schemes. First and second rows: gas temperatures in (ThES2)-model 2v and (ThES1)-model 2v, respectively. Third, fourth, and last rows: gas temperatures in (beta=3)-model 2v, (beta=10)-model 2v, and (beta=30)-model 2v, respectively. In the β-models the gas and dust temperatures are the same. The time is counted from the instance of disk formation. The scale bar is in log Kelvin.
Current usage metrics show cumulative count of Article Views (full-text article views including HTML views, PDF and ePub downloads, according to the available data) and Abstracts Views on Vision4Press platform.
Data correspond to usage on the plateform after 2015. The current usage metrics is available 48-96 hours after online publication and is updated daily on week days.
Initial download of the metrics may take a while.