Fig. 14
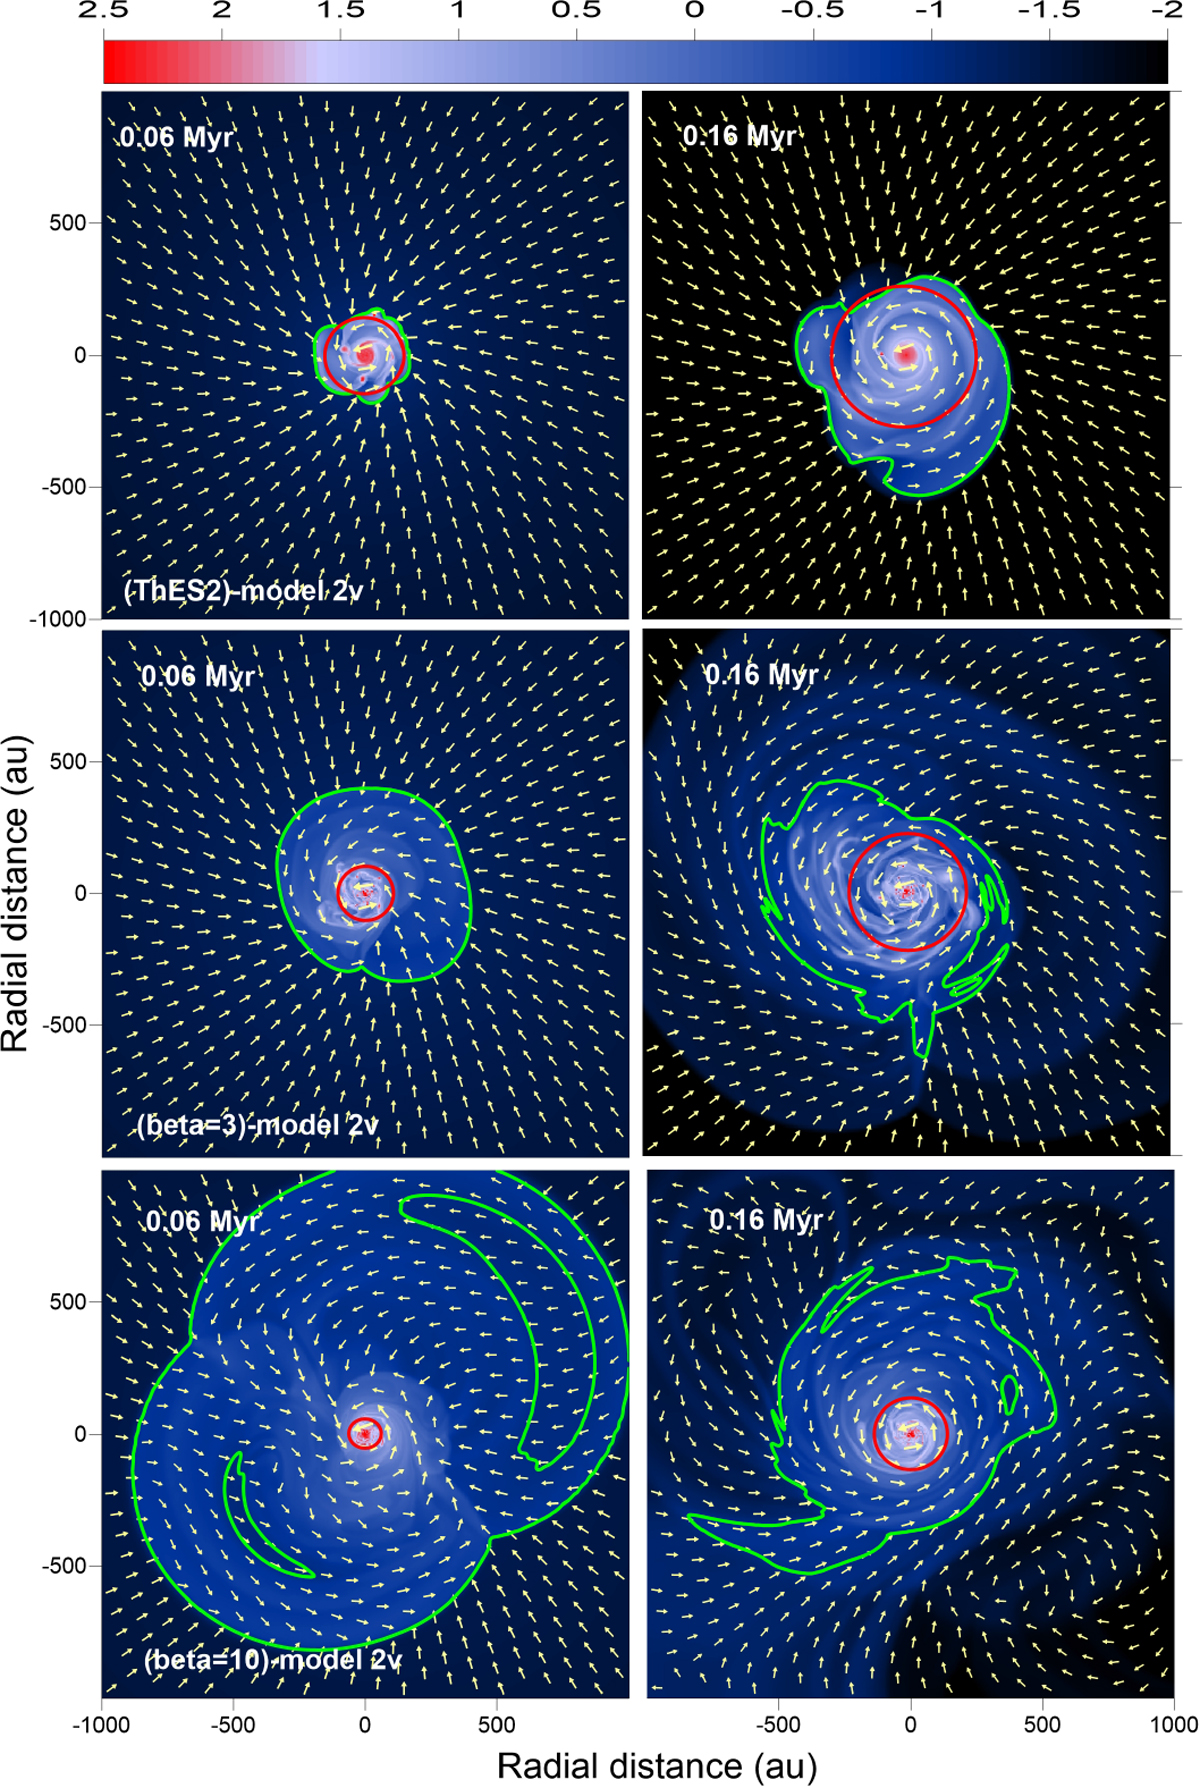
Gas velocity field superimposed on the gas surface density distribitions in (ThES2)-model 2v (top row), (beta=3)-model 2v (middle row), and (beta=10)-model 2v (bottom row) at two evolutionary times, as indicated in each panel. The red circles outline the radial distance beyond which the azimuthally averaged angular velocity deviates from the Keplerian rotation by more than 10%. The green contours outline the regions where the gas surface density drops to 0.1 g cm−1. The time is counted from the instance of disk formation. The scale bar is in log g cm−2.
Current usage metrics show cumulative count of Article Views (full-text article views including HTML views, PDF and ePub downloads, according to the available data) and Abstracts Views on Vision4Press platform.
Data correspond to usage on the plateform after 2015. The current usage metrics is available 48-96 hours after online publication and is updated daily on week days.
Initial download of the metrics may take a while.