Fig. 11
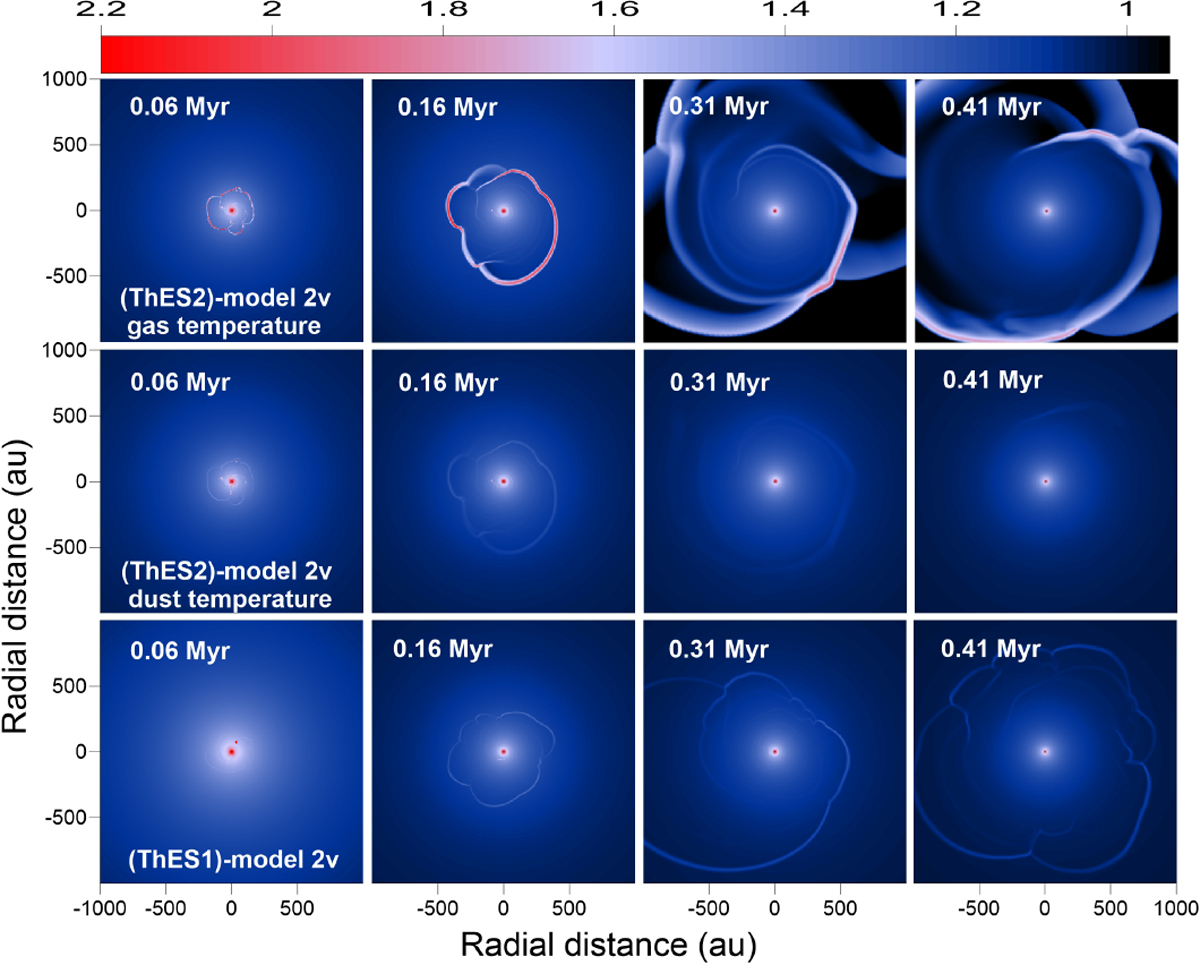
Comparison of gas and dust temperature distributions in model v2 with ThES1 and ThES2. First and second rows: gas and dust temperature distributions in ThES2. Third row: temperature distribution (the same for gas and dust) in ThES1. Bottom row: comparison of the azimuthally averaged temperatures in the two considered thermal evolution schemes. The solid lines show the temperatures of gas and dust, while the dashed lines provide the temperatures of stellar irradiation. The scale bar is in log Kelvin.
Current usage metrics show cumulative count of Article Views (full-text article views including HTML views, PDF and ePub downloads, according to the available data) and Abstracts Views on Vision4Press platform.
Data correspond to usage on the plateform after 2015. The current usage metrics is available 48-96 hours after online publication and is updated daily on week days.
Initial download of the metrics may take a while.