Free Access
Fig. 1
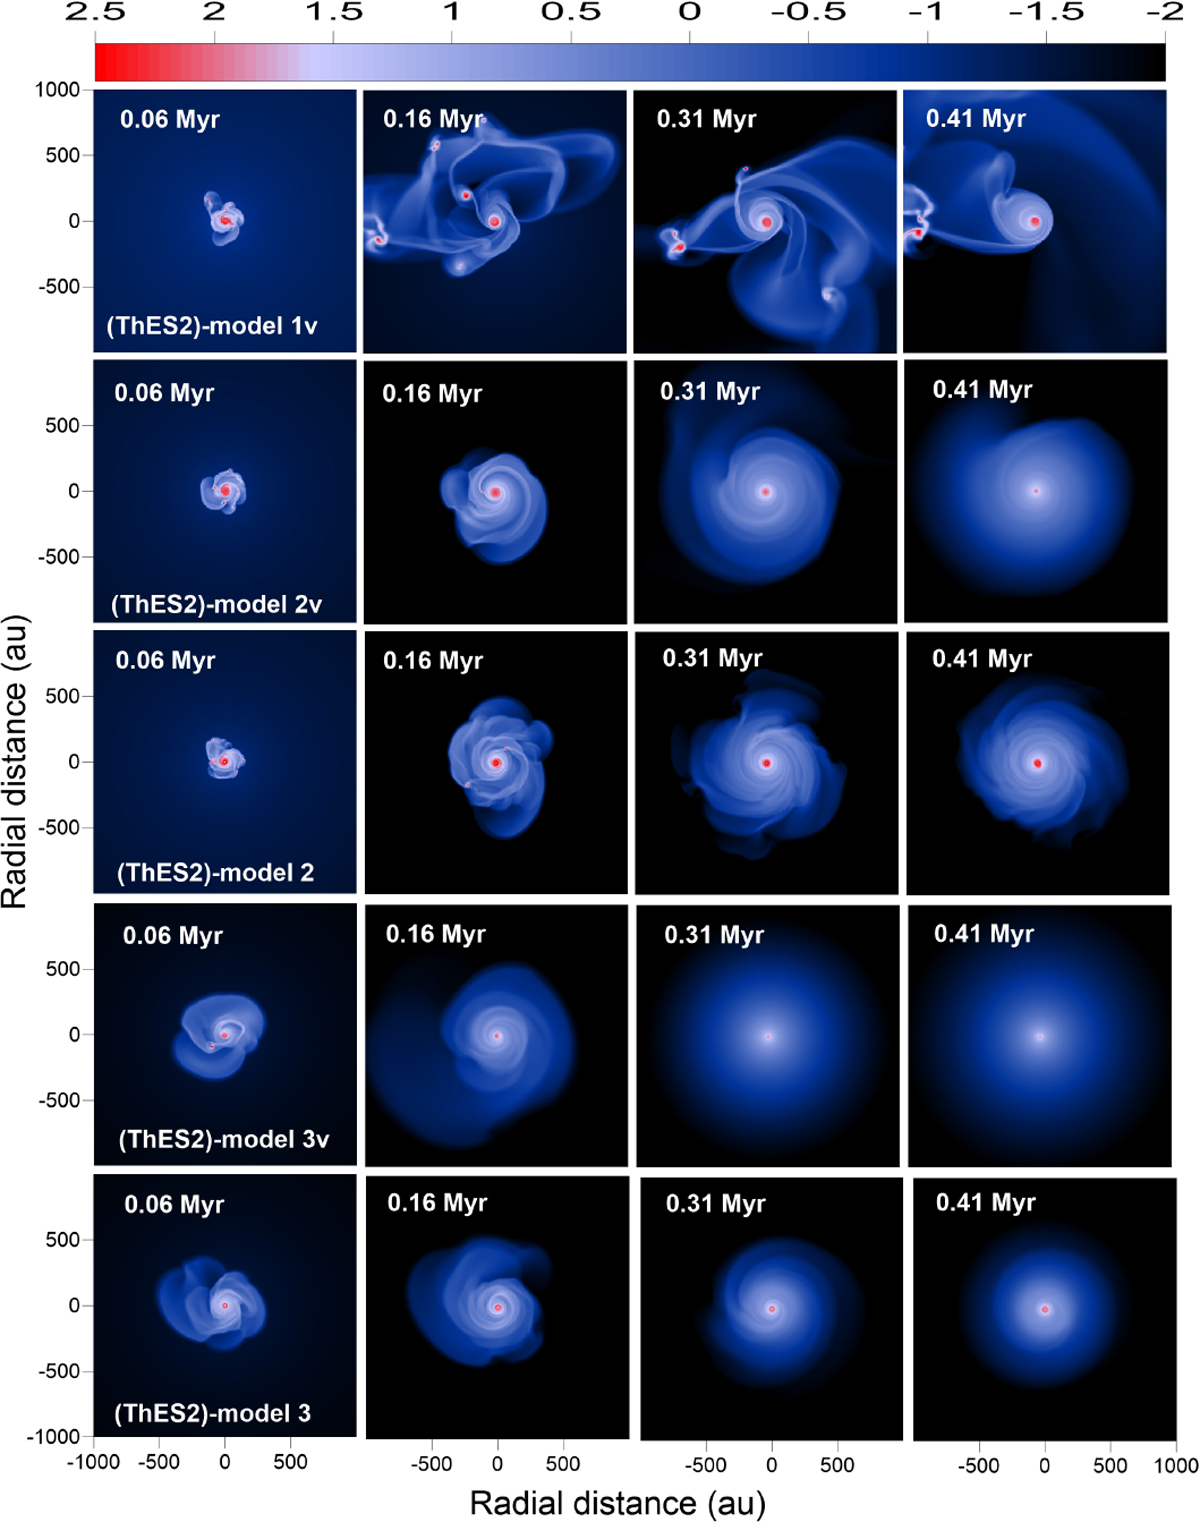
Gas surface density distributions in the five models considered. Each row presents a specific model, as indicated, and each column corresponds to a specific time starting from disk formation. The scale bar is in log g cm−2.
Current usage metrics show cumulative count of Article Views (full-text article views including HTML views, PDF and ePub downloads, according to the available data) and Abstracts Views on Vision4Press platform.
Data correspond to usage on the plateform after 2015. The current usage metrics is available 48-96 hours after online publication and is updated daily on week days.
Initial download of the metrics may take a while.