Fig. 3.
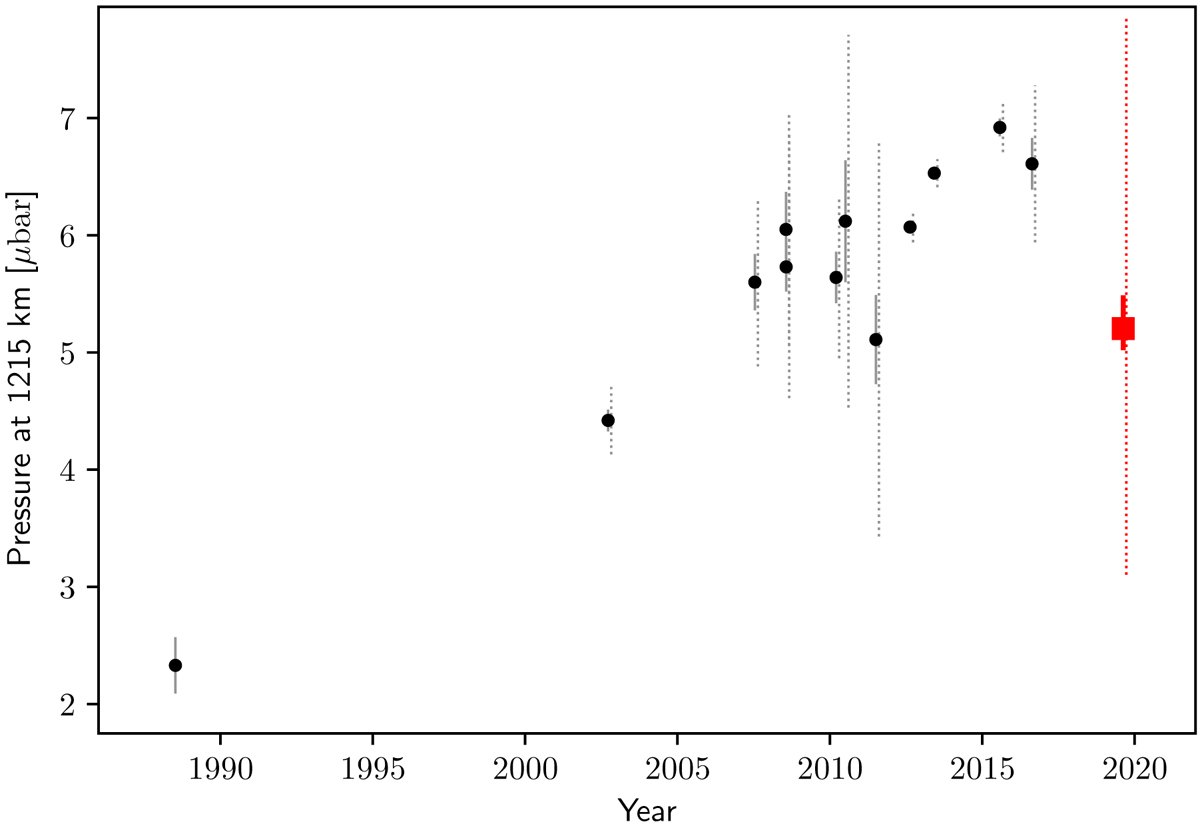
Atmospheric pressure of Pluto at r = 1215 km, p1215, as a function of time. The red square indicates the pressure value obtained in our present study (see Sect. 3), overlaid with those obtained between 1988 and 2016 using the same atmosphere model profile (black points; Meza et al. 2019; Sicardy, priv. commun.). The solid and dashed lines (horizontally shifted by +0.1 years for better visibility) represent 1σ and 3σ error bars for the data points, respectively. The 3σ error bar of the 1988 June 09 data point is not shown since the corresponding error value was not provided.
Current usage metrics show cumulative count of Article Views (full-text article views including HTML views, PDF and ePub downloads, according to the available data) and Abstracts Views on Vision4Press platform.
Data correspond to usage on the plateform after 2015. The current usage metrics is available 48-96 hours after online publication and is updated daily on week days.
Initial download of the metrics may take a while.