Fig. 3.
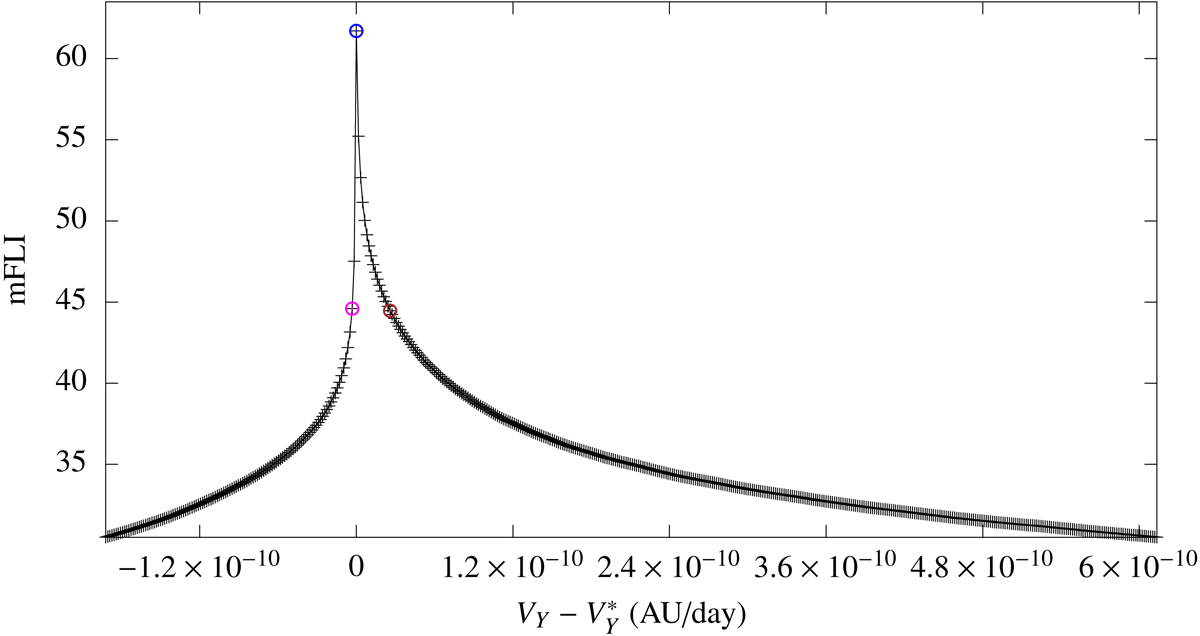
Profile of the modified FLI for the time-span of 1000 years in the case of the research of the libration with amplitude 3 × 10⁻² AU in the realistic model. The blue point denotes the location of ![]() , namely the velocity component along Y characterized by the maximum mFLI value, and the trajectory associated to the initial condition
, namely the velocity component along Y characterized by the maximum mFLI value, and the trajectory associated to the initial condition ![]() is shown in the first two panels of Fig. 4. We also show the locations of another two initial conditions (the magenta and brown point) with a different value of the chaos indicator whose trajectories are plotted in Fig. 5.
is shown in the first two panels of Fig. 4. We also show the locations of another two initial conditions (the magenta and brown point) with a different value of the chaos indicator whose trajectories are plotted in Fig. 5.
Current usage metrics show cumulative count of Article Views (full-text article views including HTML views, PDF and ePub downloads, according to the available data) and Abstracts Views on Vision4Press platform.
Data correspond to usage on the plateform after 2015. The current usage metrics is available 48-96 hours after online publication and is updated daily on week days.
Initial download of the metrics may take a while.