Fig. 2.
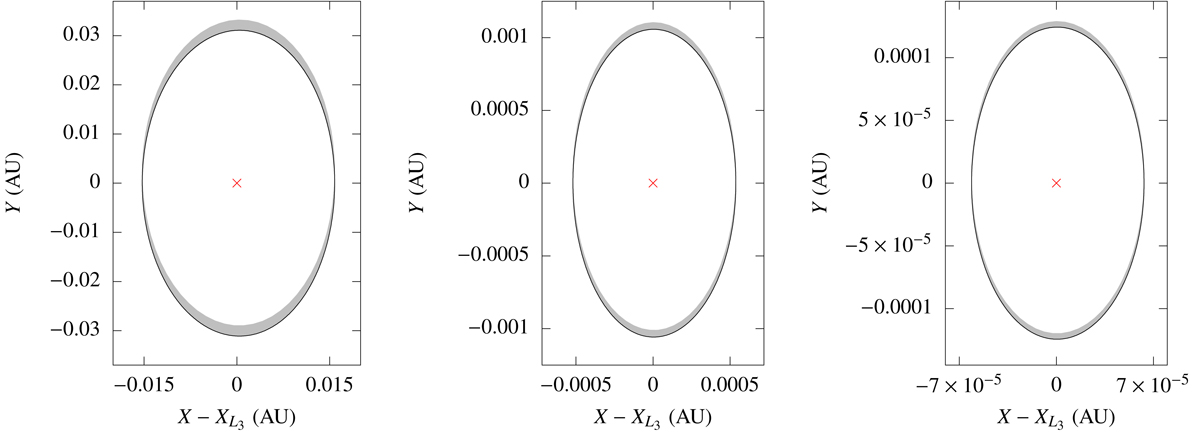
Representation of ℓ(α) orbits (gray lines) of the ER3BP in the rotating-pulsating reference frame with α = 3 × 10⁻², 10−3, 10−4 AU for 1000 years. The values of ![]() in the three different cases are 10−3, 7 × 10⁻⁵, and 10−5 AU. The representation of ℓ(α) in the time-span of 1 year (black curves) emphasizes the small drifts of the librations along the Y axis. The red point indicates the position of L3.
in the three different cases are 10−3, 7 × 10⁻⁵, and 10−5 AU. The representation of ℓ(α) in the time-span of 1 year (black curves) emphasizes the small drifts of the librations along the Y axis. The red point indicates the position of L3.
Current usage metrics show cumulative count of Article Views (full-text article views including HTML views, PDF and ePub downloads, according to the available data) and Abstracts Views on Vision4Press platform.
Data correspond to usage on the plateform after 2015. The current usage metrics is available 48-96 hours after online publication and is updated daily on week days.
Initial download of the metrics may take a while.