Fig. 8.
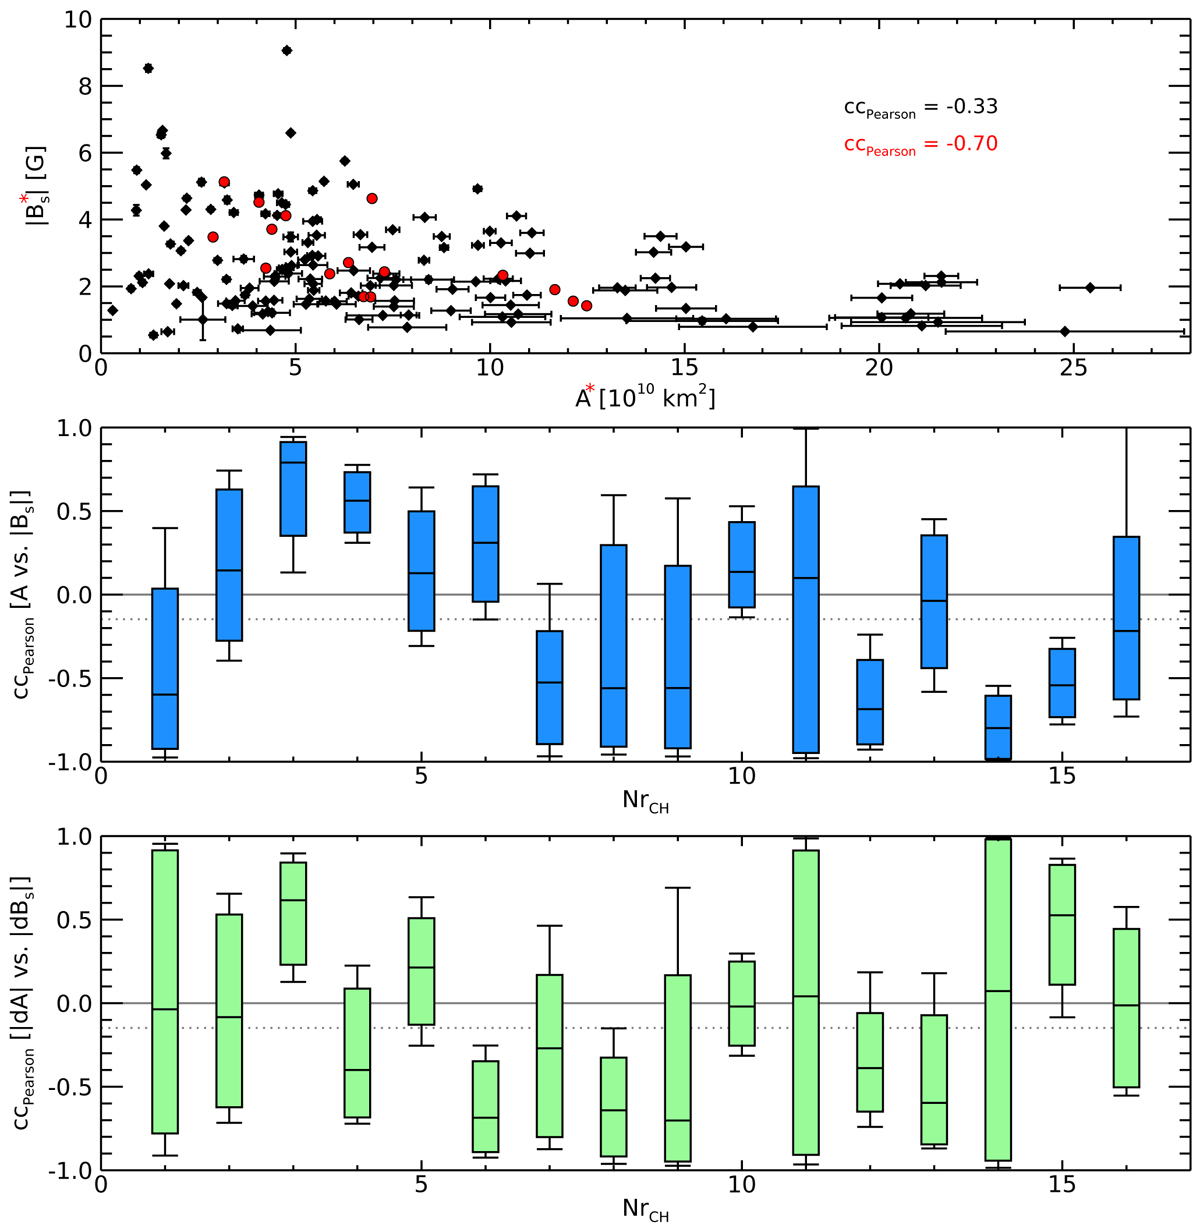
Scatterplot of the absolute value of the signed mean magnetic flux density of CHs as a function of the CH area. Top panel: all observations (in red the average values over each evolution). Middle panel: evolution of each CH individually. Bottom panel: correlation between change in area and change in magnetic flux density for each CH evolution individually. Middle and bottom panels: the median of the bootstrapped sample for each evolution is represented by the horizontal line in the bar, the green and blue bars represent the 80% percentiles, and the whiskers the 90% percentiles. The dotted line gives the mean of the median values.
Current usage metrics show cumulative count of Article Views (full-text article views including HTML views, PDF and ePub downloads, according to the available data) and Abstracts Views on Vision4Press platform.
Data correspond to usage on the plateform after 2015. The current usage metrics is available 48-96 hours after online publication and is updated daily on week days.
Initial download of the metrics may take a while.