Free Access
Fig. 3.
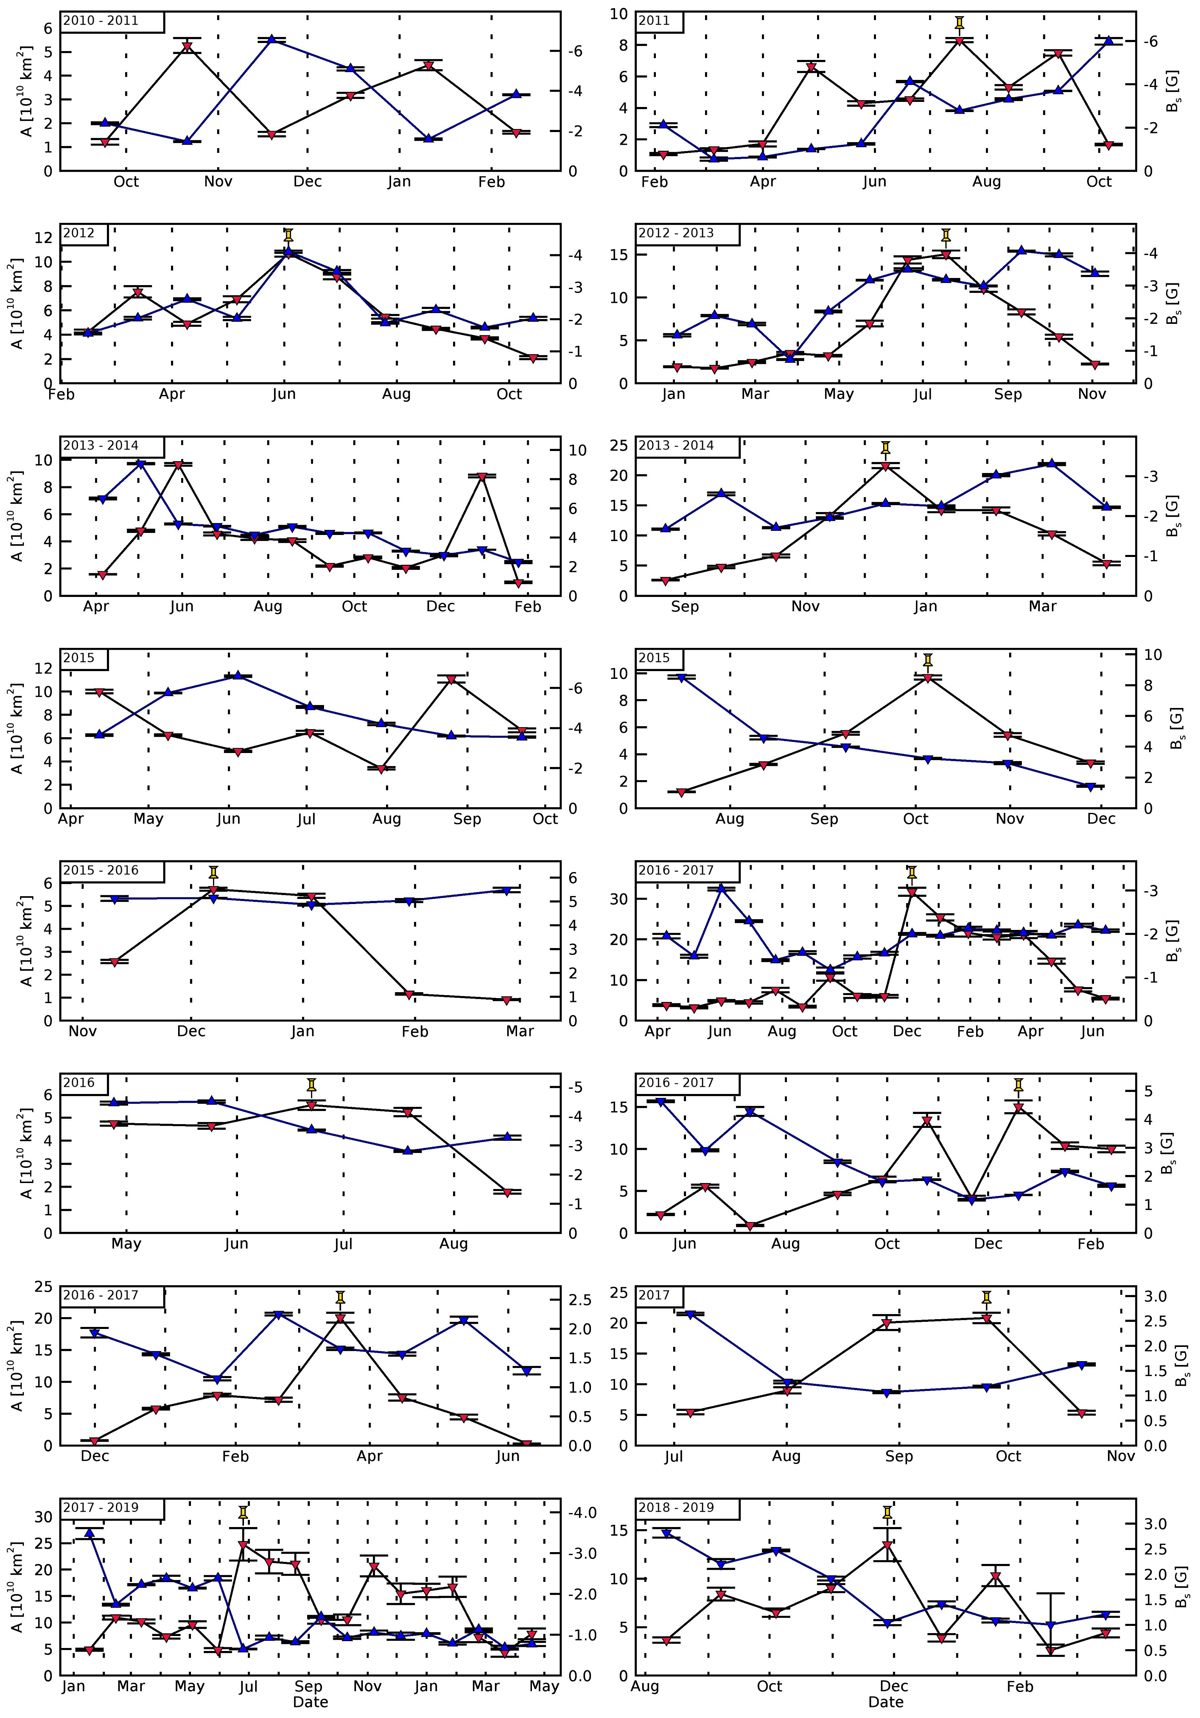
Evolution of the area (black–red) and magnetic flux density (blue) of all CHs under study. The error bars represent the uncertainties. The vertical dashed guidelines represent the first day of each month and the yellow pin marks the peak in the observed CH area (if a clear peak was associated).
Current usage metrics show cumulative count of Article Views (full-text article views including HTML views, PDF and ePub downloads, according to the available data) and Abstracts Views on Vision4Press platform.
Data correspond to usage on the plateform after 2015. The current usage metrics is available 48-96 hours after online publication and is updated daily on week days.
Initial download of the metrics may take a while.