Fig. 2.
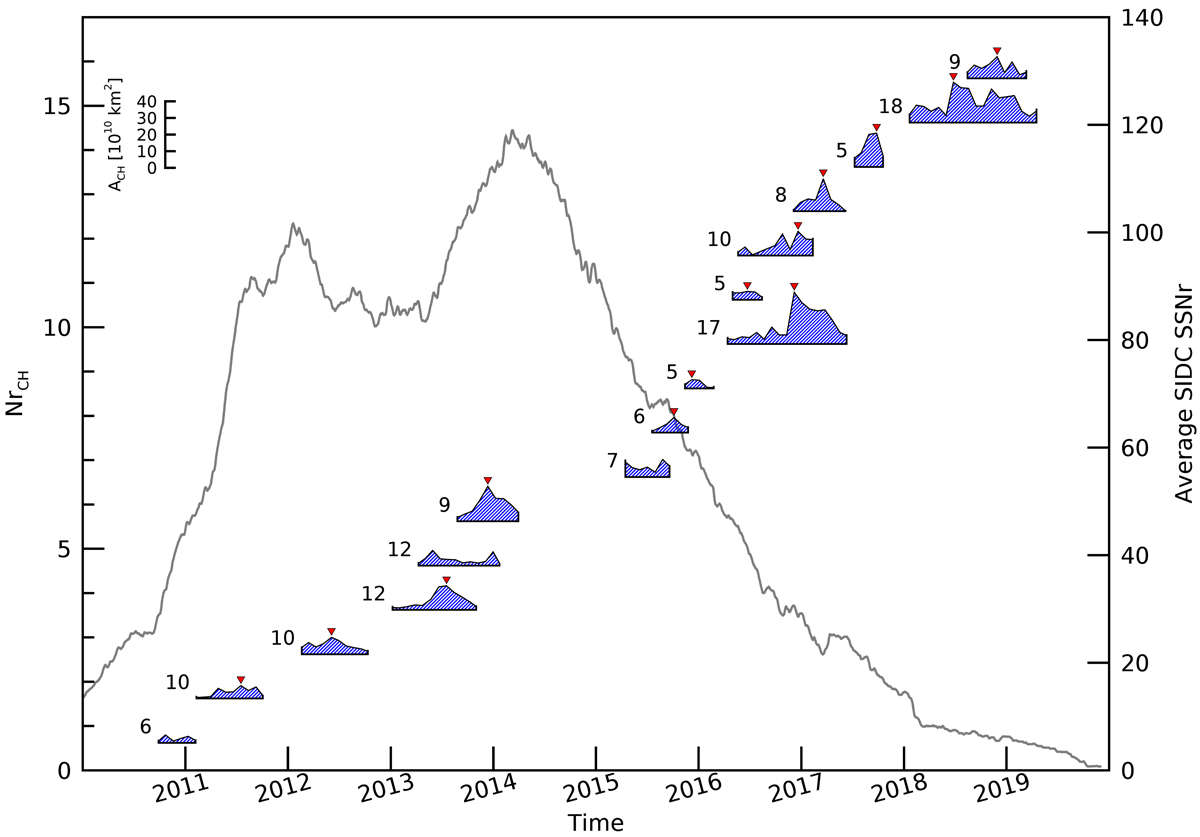
Temporal evolution of all the CHs under study. The length of the bars represents the lifetime from the first to the last observation near the central meridian. The profile displays the area evolution (scale in the left corner of the figure). The red triangle marks the peak in the CH area. If no clear central peak was detected, the mark was omitted. The number in front of the bars shows how many times the CH was observed passing the central meridian. The solar activity, approximated by the smoothed sunspot number (Source: WDC-SILSO, Royal Observatory of Belgium, Brussels), is shown in the background.
Current usage metrics show cumulative count of Article Views (full-text article views including HTML views, PDF and ePub downloads, according to the available data) and Abstracts Views on Vision4Press platform.
Data correspond to usage on the plateform after 2015. The current usage metrics is available 48-96 hours after online publication and is updated daily on week days.
Initial download of the metrics may take a while.