Free Access
Fig. A.1.
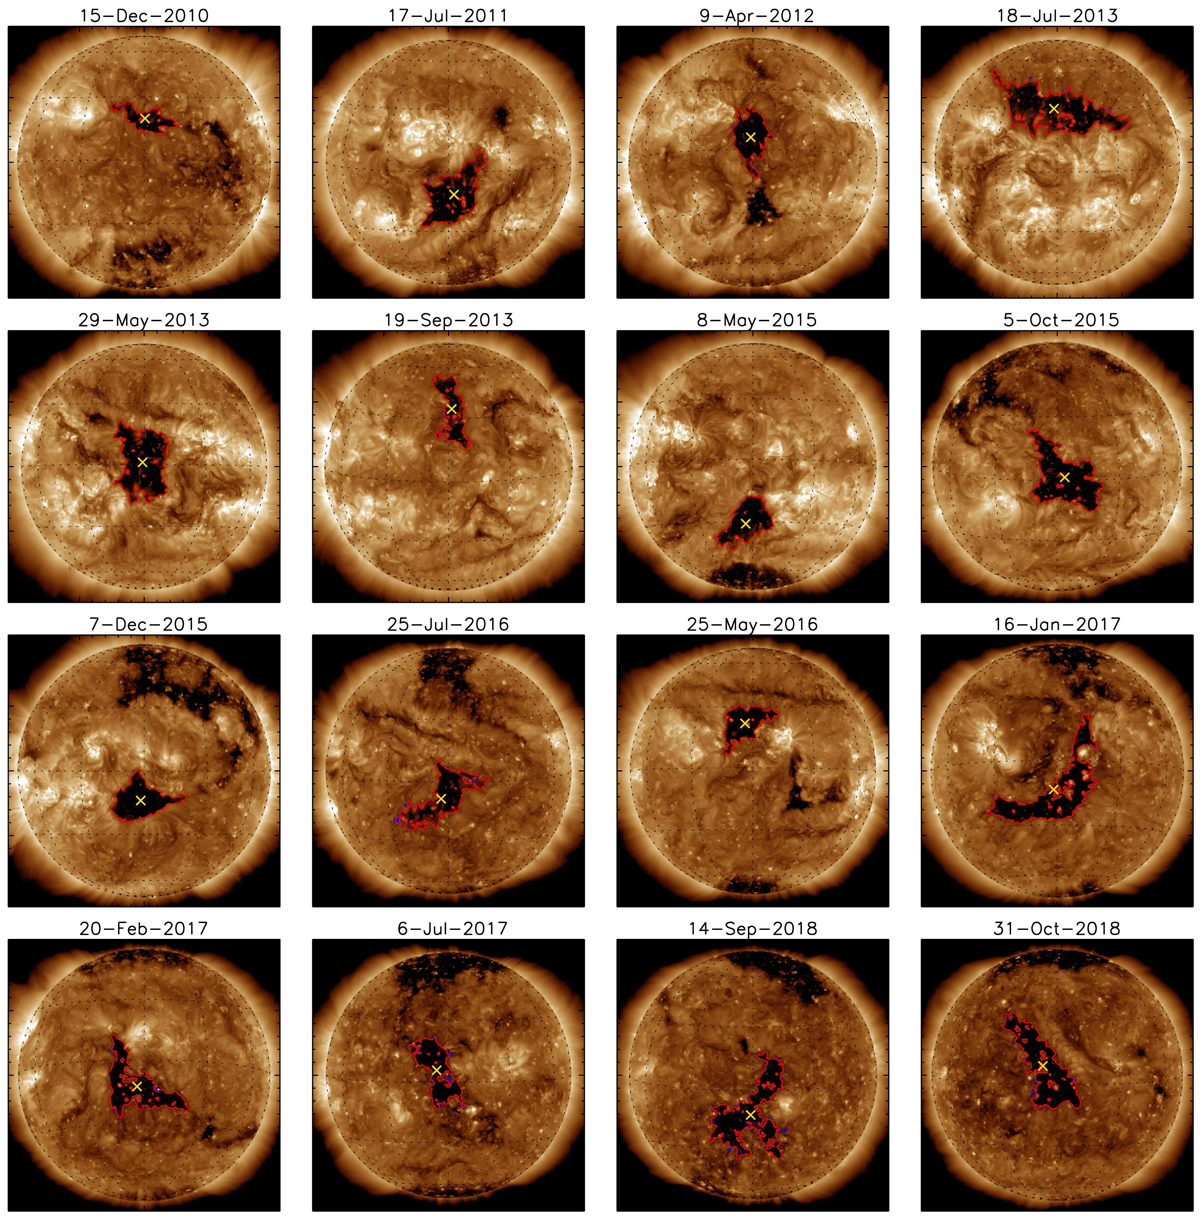
Example snapshot of CH under study. The extracted CH boundary is given by the red line and the center of mass is represented by the yellow x. The blue shaded areas represent the uncertainties as calculated by CATCH.
Current usage metrics show cumulative count of Article Views (full-text article views including HTML views, PDF and ePub downloads, according to the available data) and Abstracts Views on Vision4Press platform.
Data correspond to usage on the plateform after 2015. The current usage metrics is available 48-96 hours after online publication and is updated daily on week days.
Initial download of the metrics may take a while.