Fig. 1.
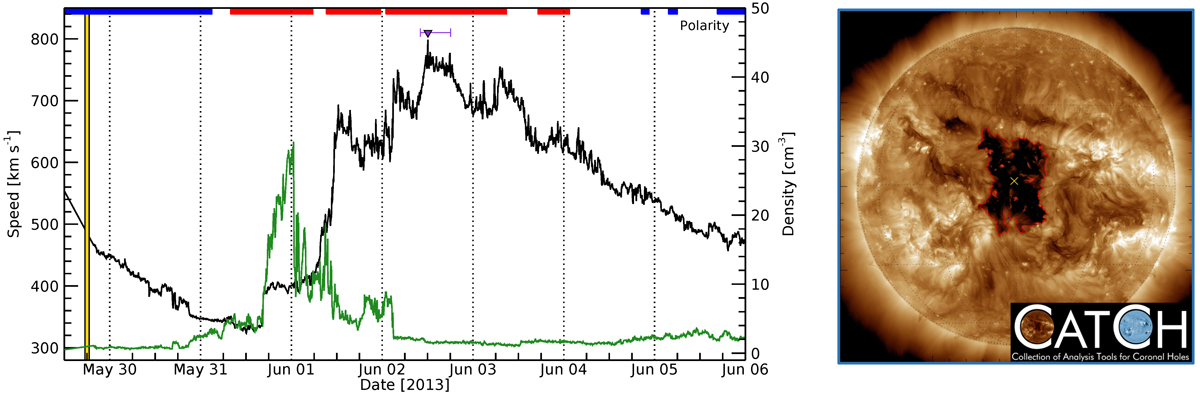
Example of an in-situ signature of the solar wind data provided by the OMNI database (left), as a CH under study was observed near the center of the solar disk by SDO on May 29, 2013, at 18 UT (right). The black line shows the solar wind bulk velocity and green line represents the plasma density. The purple triangle represents the peak velocity and the horizontal bar the average interval to show the plateau speed. The colored bar on the top represents the in-situ polarity calculated after Neugebauer et al. (2002), with red being positive and blue negative polarity. Right panel: snapshot of the CH that is associated with this HSS, and the time of the SDO observation corresponds to the yellow vertical line in the left panel. The red line is the extracted CH boundary (using CATCH) and the yellow x represents the center of mass of the CH.
Current usage metrics show cumulative count of Article Views (full-text article views including HTML views, PDF and ePub downloads, according to the available data) and Abstracts Views on Vision4Press platform.
Data correspond to usage on the plateform after 2015. The current usage metrics is available 48-96 hours after online publication and is updated daily on week days.
Initial download of the metrics may take a while.