Fig. 6.
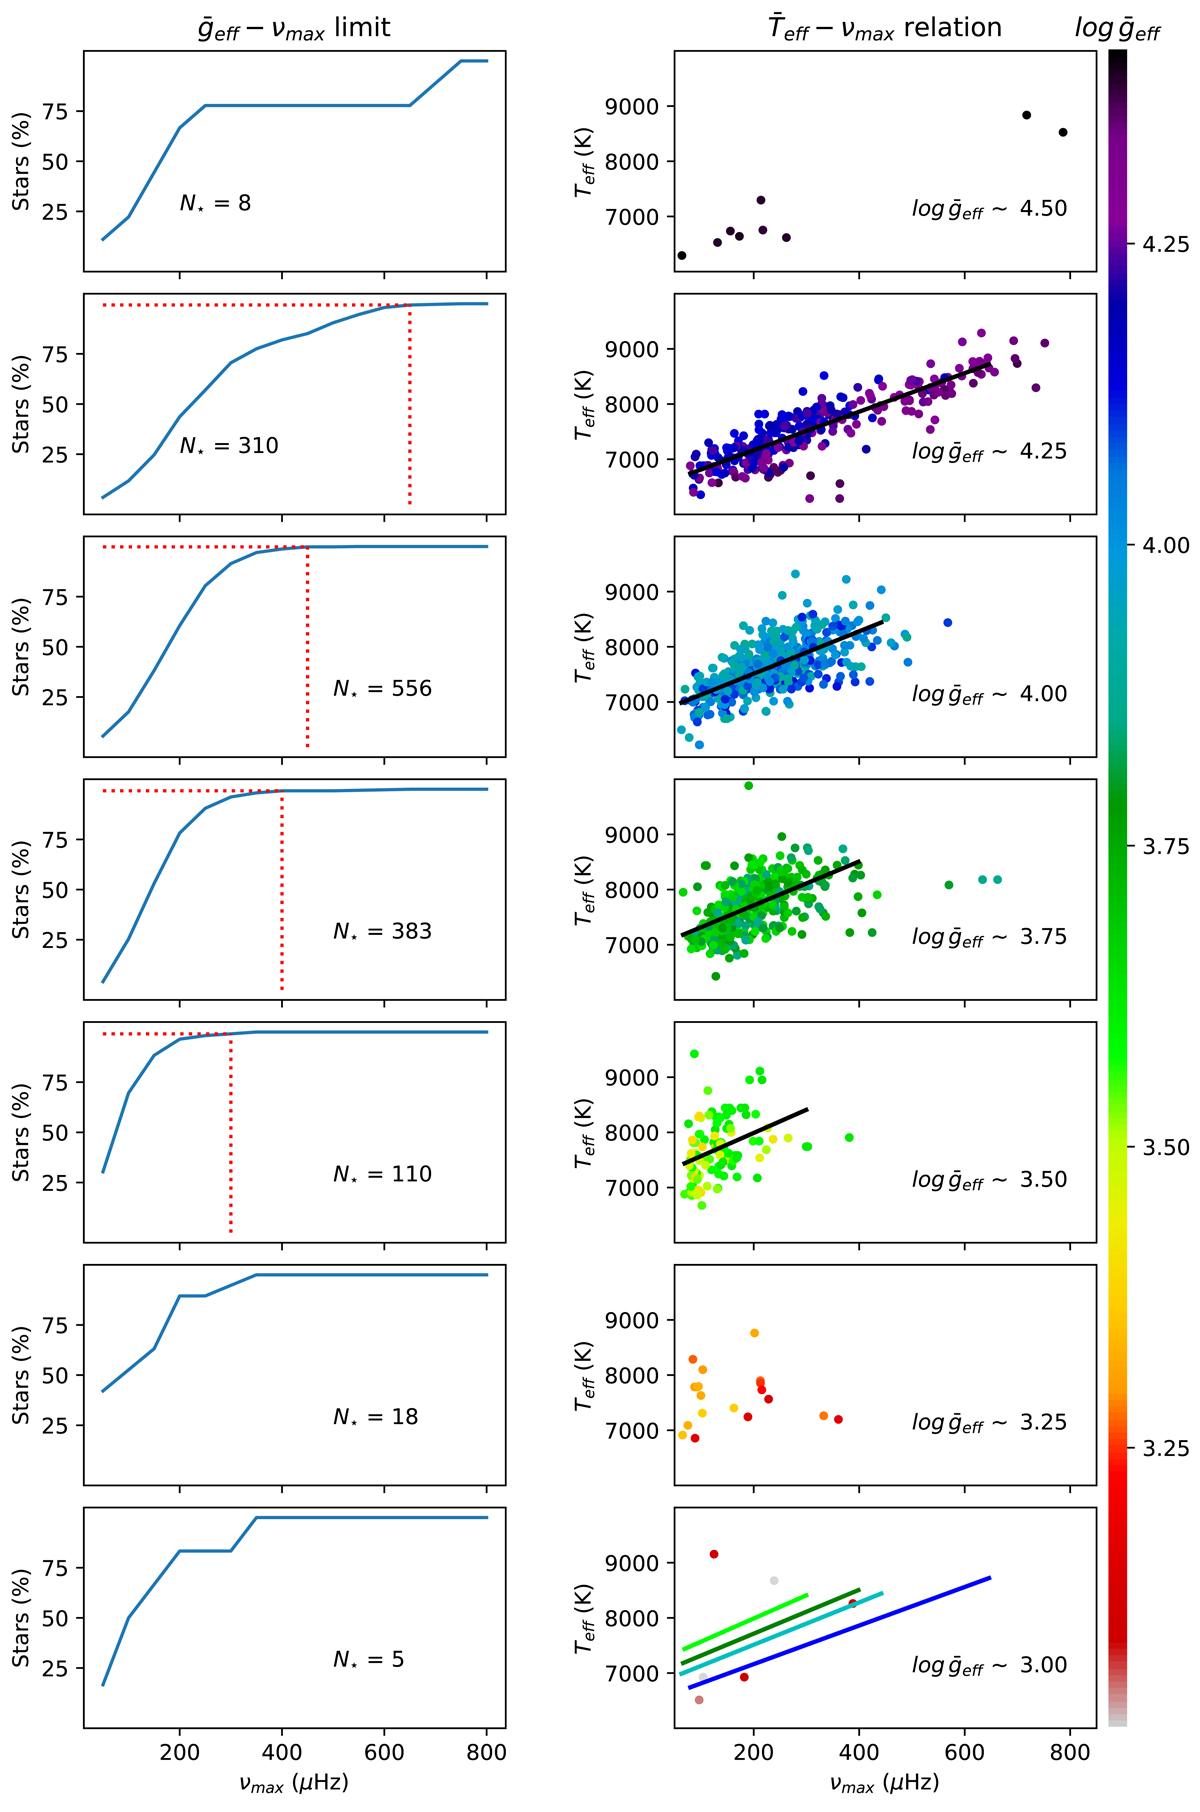
From bottom to top, left panels: cumulative histogram of the population of stars per νmax and higher ![]() . Red dotted lines point to the 99% of the population limit (see text). We indicate the number of stars per group (N⋆). From bottom to top, right panels: relation between νmax and
. Red dotted lines point to the 99% of the population limit (see text). We indicate the number of stars per group (N⋆). From bottom to top, right panels: relation between νmax and ![]() for δ Scuti stars of the same group (solid line, see text). The colour of each star indicates its
for δ Scuti stars of the same group (solid line, see text). The colour of each star indicates its ![]() . Bottom right panel: each coloured line represents the scaling relation for each group.
. Bottom right panel: each coloured line represents the scaling relation for each group.
Current usage metrics show cumulative count of Article Views (full-text article views including HTML views, PDF and ePub downloads, according to the available data) and Abstracts Views on Vision4Press platform.
Data correspond to usage on the plateform after 2015. The current usage metrics is available 48-96 hours after online publication and is updated daily on week days.
Initial download of the metrics may take a while.