| Issue |
A&A
Volume 675, July 2023
|
|
|---|---|---|
| Article Number | A167 | |
| Number of page(s) | 19 | |
| Section | Stellar structure and evolution | |
| DOI | https://doi.org/10.1051/0004-6361/202346323 | |
| Published online | 14 July 2023 | |
Dating young open clusters using δ Scuti stars
Results for Trumpler 10 and Praesepe⋆
Departamento de Física Teórica y del Cosmos, Universidad de Granada, Campus de Fuentenueva s/n, 18071 Granada, Spain
e-mail: This email address is being protected from spambots. You need JavaScript enabled to view it.
Received:
4
March
2023
Accepted:
31
May
2023
Abstract
Aims. The main goal of this work is to date young open clusters using δ Sct stars. Seismic indices such as the large separation and the frequency at maximum power can help constrain the models to better characterise the stars. We propose a reliable method to identify some radial modes, which would give us greater confidence in the constraints placed on the models.
Methods. We extracted the frequency content of a sample of δ Sct stars belonging to the same open cluster. We estimated the low-order large separation by means of different techniques and the frequency at maximum power for each member of the sample. We used a grid of models built with the typical parameters of δ Sct stars, including mass, metallicity, and rotation as independent variables, and we determined the oscillation modes. We selected the observed frequencies whose ratios match those of the models. Once we established a range of radial modes matching the observed frequencies, mainly the fundamental mode, we added it to the other seismic parameters to derive the stellar ages. Assuming star groups have a similar chemistry and age, we estimated their mean ages by computing a weighted probability density function fit to the age distribution of the seismically constrained models.
Results. We estimated the age of Trumpler 10 to be 30−20+30 Myr and that of Praesepe to be 580 ± 230 Myr. In this latter case, we find two apparent populations of δ Sct stars in the same cluster, one at 510 ± 140 Myr and another at 890 ± 140 Myr. This may be due to two different stellar formation events, a variety of rotational velocities among the members in our sample of stars (as rapid rotation may modify the observed large separation) or membership to unresolved binary systems.
Key words: asteroseismology / stars: variables: δ Scuti / open clusters and associations: general
Full Table A.1 is only available at the CDS via anonymous ftp to cdsarc.cds.unistra.fr (130.79.128.5) or via https://cdsarc.cds.unistra.fr/viz-bin/cat/J/A+A/675/A167
© The Authors 2023
 Open Access article, published by EDP Sciences, under the terms of the Creative Commons Attribution License (https://creativecommons.org/licenses/by/4.0), which permits unrestricted use, distribution, and reproduction in any medium, provided the original work is properly cited.
This article is published in open access under the Subscribe to Open model. This email address is being protected from spambots. You need JavaScript enabled to view it. to support open access publication.
1. Introduction
Determining the age of a star is essential to understanding its internal physics. In dating a star cluster, the importance lies in understanding the structure and evolution of the galaxy. However, age is not a direct observable and inferring it accurately is not a straightforward task. In addition, ambiguity arises since we cannot be sure that all the stars in the cluster formed at the same epoch. Recent works have shown that different populations (or generations) of stars may coexist within the same cluster (e.g. Bastian & Lardo 2018). For instance, Costa et al. (2019) found two distinct populations of stars aged 176 Myr and 288 Myr in NGC 1866 by combining an analysis of its best-studied Cepheids with that of a very accurate colour-magnitude diagram obtained with the Hubble Space Telescope photometry. Other works, such as that of Krause et al. (2020), assume that most open clusters feature a single population, as they remain essentially clear of gas and winds after one stellar formation event. We have assumed this hypothesis in order to determine a mean age for each of the clusters we analyse here.
Traditionally, isochrone fittings on the Hertzsprung-Russell diagram (HRD) have been used to date clusters. This method works best when dealing with old globular clusters, where we can find a large sample of stars leaving the main sequence and evolving past the turn-off point. However, the ambiguity of this method is apparent with respect to young clusters, whereby a majority of stars are still on the main sequence (MS). The method based on spectroscopic observations of lithium (Basri & Martín 1999; Stauffer 1999) also generates large ambiguities because of unresolved binary stars (Martín et al. 2001). The relation between the rotation rate and the age of late F to M stars, called gyrochronology (Barnes 2003; Angus et al. 2022; Messina et al. 2022), seems to provide a useful method of reducing the uncertainty on the age of evolved clusters. Other methods based on chemical clocks (da Silva et al. 2012; Spina et al. 2017; Moya et al. 2022) seem to help reduce the uncertainties, making use of machine learning techniques. The drawback is that these algorithms are trained on the basis of models of highly evolved stars, for which it has been possible to obtain reliable spectroscopic observations. Therefore, despite the progress achieved with these new techniques, we still do not have a reliable method for dating young open clusters.
In Pamos Ortega et al. (2022, Paper I, henceforth), we proposed the use of seismic parameters to date a group of four δ Sct stars belonging to the young open cluster α Per. One of these seismic indices is the large separation, defined as the difference between acoustic modes of the same degree and consecutive radial orders, related to the mean density and the surface gravity of the star. This regularity in the frequency pattern is also present in the low-order regime (n = [2, 8]; Suárez et al. 2014; García Hernández et al. 2015, 2017; Mirouh et al. 2019), where δ Sct stars show their oscillation modes. Another parameter is the frequency at maximum power, directly related to the effective temperature, used in solar-type stars and found in δ Sct stars as well (Barceló Forteza et al. 2018, 2020; Bowman & Kurtz 2018; Hasanzadeh et al. 2021).
In this work, we date the young open clusters Trumpler 10 and Praesepe, using a corresponding sample of δ Sct stars. We use only seismic parameters, such as the low-order large separation and the frequency at maximum power. We also include the identification of the fundamental mode of each star, estimated by comparing the frequency ratios of the observed frequencies with that of the models. These clusters are of very different ages, which allows us to establish the possibilities of the method.
The structure of the paper is as follows. In Sect. 2, we provide the estimated ages of the clusters Trumpler 10 and Praesepe from previous works. In Sect. 3, we introduce the sample of δ Sct stars used in this research. In Sect. 4, we present how their seismic parameters have been computed. In Sect. 5, we describe the details of the grids of models built to characterise our δ Sct stars. In Sect. 6, we explain the method to estimate the mean age of the cluster. In Sect. 7, we present the ages we estimate and discuss their reliability by comparing them with the observed parameters and the literature. Finally, in Sect. 8, we lay out the main conclusions of our research and leads for improving our method.
2. Ages of Trumpler 10 and Praesepe in the literature
Trumpler 10 and Praesepe have been dated through many different techniques. Table 1 summarises the ages and metallicities derived in the last twenty years.
Ages and metallicities for Trumpler 10 and Praesepe from some of the main references of the last twenty years and used in this work.
Trumpler 10 (C 0846–423) is an open cluster located in the Vela constellation. According to the Milky Way Star Clusters catalogue (MWSC, Kharchenko et al. 2013), it is at a distance of about 417 pc from the Sun and has an age of log(age) = 7.380 (≈34 Myr). According to Netopil et al. (2016), it has an age of 40 ± 10 Myr, with a metallicity of [Fe/H] = −0.12 ± 0.06, obtained from various photometric systems and calibrations. The work of Dias et al. (2021) computes the age for this cluster in log(age) = 7.753 ± 0.026 (≈57 Myr), with a metallicity of [Fe/H] = 0.043 ± 0.050. For these estimates, they used Gaia DR2 photometry and a grid of Padova isochrones. According to all these references, the age of Trumpler 10 lies between 34 Myr and 57 Myr.
Praesepe (M 44, NGC 2632) is an open cluster located in the Cancer constellation. As it is one of the closest clusters to the Sun, it is also one of the most studied (see for example Suárez et al. 2002; Meibom & Mathieu 2005; Fossati et al. 2008; Brandt & Huang 2015; Choi et al. 2016; Cummings et al. 2017; Gaia Collaboration 2018, and references therein). When taking as reference the MWSC survey, it is at a distance of about 187 pc and has an age of log(age) = 8.920 (≈729 Myr). According to Netopil et al. (2016), it has an age of 730 ± 190 Myr and a metallicity of [Fe/H] = 0.13 ± 0.03, also obtained from different photometric systems, as for Trumpler 10. The work of Dias et al. (2021) yields log(age) = 8.882 ± 0.035 (≈762 Myr), with a metallicity of [Fe/H] = 0.196 ± 0.039. Zhong et al. (2020) estimated the metallicity at [Fe/H] = 0.22 ± 0.08, using LAMOST spectroscopy. Meibom & Mathieu (2005) provided an age estimate for Praesepe of about 630 Myr, using a completely different technique that involves looking at the circularization of binary systems of solar-like stars; namely, this circularization happens over time, so systems become circular at higher and higher separations, so that the measurement of the period of circular systems yields an age value. Douglas et al. (2019) estimated an age of 670 ± 67 Myr. Specifically, they computed the age of the open cluster Hyades, using a gyrochronology model tuned with slow rotators in Praesepe and the Sun, assuming that the two clusters are coeval, based on the similarity of their colour-magnitude diagrams, activity, rotation and lithium abundance. In short, all these references of the last twenty years provide ages for Praesepe between 590 and 790 Myr.
3. The data
Firstly, we cross-matched the VizieR online data catalogue of Gaia DR2 open cluster members (Cantat-Gaudin et al. 2018) and the TESS Input Catalogue (TIC, Stassun 2019), searching through possible δ Sct stars belonging to the same open cluster.
According to the definition of a pure δ Sct from Grigahcène et al. (2010) and Uytterhoeven et al. (2011), we found five candidates in the field of Trumpler 10 (Table 2) and six in the field of Praesepe (Table 3). For our Praesepe stars, we found values for the projected rotational velocity, v sin i, the metallicity, and the spectral type, consulting the available references in the Simbad Astronomy Database1. For the Trumpler 10 stars, only data about the spectral type were available. These parameters are useful in our discussion of the results, presented in Sect. 7.
Stellar parameters of the selected targets in Trumpler 10.
Stellar parameters of the selected targets in Praesepe.
We performed a frequency analysis using data from sector 35 of the TESS mission (Ricker et al. 2014) for the Trumpler 10 sample, with approximately 13 800 points, and approximately 15 500 points from sector 45 for Praesepe. In both cases, the cadence is about 2 min and the Rayleigh resolution is approximately 0.041 d−1. We used the pre-search data conditioned (PDC) light curves, corrected for instrumental effects, that are publicly available through the TESS Asteroseismic Science Consortium2 (TASC).
Using MULTIMODES3, we extracted the frequency content of each star in our sample. It is a Python code that calculates the Fast Lomb-Scargle periodogram (Press & Rybicki 1989) of a light curve. It extracts (one by one) a limited number of significant signals, and uses their corresponding parameters (amplitudes and frequencies) to fit the total signal to a multisine function with a non-linear least-squares minimisation. We adopted a signal-to-noise ratio of S/N > 4.0 as a stop criterion (Breger et al. 1993) to avoid spurious frequencies and we filtered out possible frequency combinations. The code is presented in detail in Paper I and in the public repository.
Figures 1 and 2 show, respectively, the extracted frequency spectrum of each δ Sct candidate in Trumpler 10 and Praesepe. The values of the ten highest amplitudes frequencies for each star in both clusters are shown in Table A.1. The table of all extracted frequencies is available at the CDS.
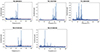 |
Fig. 1. Frequency spectrum of the sample of δ Sct stars candidates in the field of Trumpler 10. The red dotted line is the significance threshold, S/N = 4. |
4. Seismic parameters
It is sometimes possible to find regularities in the complex frequency pattern of a δ Sct star (García Hernández et al. 2009; Paparó et al. 2016; Bedding et al. 2020). Following the same techniques as in García Hernández et al. (2009, 2013), Ramón-Ballesta et al. (2021) and used in Paper I, we estimated the large separation in the low-order regime, Δνlow. Figure 3 shows an example of this, where we used the discrete Fourier transform (DFT), the autocorrelation diagram (AC) applied on the frequencies, the frequency difference histogram (FDH), and the échelle diagram (ED) to find regularities in the frequency content of TIC 28943819 (see Appendix B for the rest of our sample). The theoretical works of García Hernández et al. (2009), Reese et al. (2017) used the AC and the FT to search for the low-order large separation. They point out that we expect to see the large separation and its submultiples in the DFT and its multiples in the AC and the FDH – except in the case where the l = 1 modes lie halfway between the l = 0 modes, as in solar-type stars, where we also find half the large separation. No method on its own is objective enough to yield a reliable measurement for Δνlow, except in very few cases. Our criterion requires finding the same peaks in at least two of the methods used for measuring Δνlow or half Δνlow. We estimated the uncertainties using the width of the peaks in the DFT or the AC, depending on the case. Of all the stars analysed this way, TIC 28944596 and TIC 271062192 are the most difficult cases. TIC 28944596 (see Fig. B.2) only has a few frequencies. Its DFT shows a peak a bit above 20 μHz and another around 40 μHz. The AC also shows two peaks very close to 80 μHz, and the FDH shows three peaks between 70 and 80 μHz. For all these reasons, we estimated the large separation to be 80 μHz for this star. TIC 271062192 (Fig. B.4) is an even more complicated case, because the AC, FDH, and ED do not show regularities in the frequency content. The only evidence here is DFT, which shows three congruent peaks around 19, 38, and 76 μHz. This is why we have retained a large separation estimate of 76 μHz.
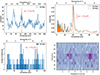 |
Fig. 3. Estimated low-order large separation for TIC 28943819, using the autocorrelation diagram (top-left), the discrete Fourier transform (top-right), the frequency difference histogram (bottom-left), and the échelle diagram (Hey & Ball 2020, bottom-right). |
Barceló Forteza et al. (2020) found a scaling relation between the frequency at maximum power (νmax) and the effective temperature in a sample of more than 2000 δ Sct stars. They define νmax as the average frequency weighted over the amplitudes, Ai, of the frequencies, νi, of the envelope as follows:
 (1)
(1)
Another independent study (Hasanzadeh et al. 2021) found a similar correlation based on a sample of more than 400 δ Sct stars. They used the AC method on several windows of the S/N periodogram to obtain the range of frequencies for the modes’ envelope. Then, a Gaussian curve was fitted to the mean collapsed correlation with each window. The peak of this curve is their νmax. However, such a correlation between νmax and the effective temperature was recently debated by Bedding et al. (2023), who did not see it in their study of a sample of 35 δ Sct stars in the Pleiades cluster. The νmax definitions of Barceló Forteza et al. (2020) and Hasanzadeh et al. (2021), both based on the envelope, are more stable than choosing the frequency with the highest amplitude, as done by Bedding et al. (2023), since this frequency is more likely to vary with time in the presence of non-linear effects than the envelope. Despite the large uncertainty involved in using νmax as a seismic parameter, we decided to trust it as a seismic indicator.
Following Barceló Forteza et al. (2020), we can relate νmax and  . The relation depends on the value of log g, so for Trumpler 10 (log g ≈ 4.3), we use:
 (2)
(2)
while for Praesepe (log g ≈ 4.0), we use:
 (3)
(3)
The estimated values for Δνlow, νmax and their corresponding seismic temperatures,  , for our sample of δ Sct stars in Trumpler 10 and Praesepe are shown in Table 4. Comparing the values of TIC effective temperature and the seismic temperature, we see that the agreement is good for the majority of the sample, taking into account the large uncertainties of the seismic temperature. However, TIC 30307085 and TIC 271062192 are discrepant, with differences between the two estimates above 1000 K, which may be a signature of a binary companion or gravity darkening induced by rapid rotation.
Seismic indices of the selected targets from Trumpler 10 and Praesepe: the low-order large separation, frequency at maximum power, and its corresponding seismic and TIC effective temperature.
5. Grids of the models
As δ Sct are usually moderate to fast rotators (v sin i > 100 km s−1), the models have to take into account the stellar structure deformation that occurs at these speeds. This centrifugal flattening reduces the value of the mean density, directly related to one of the seismic indices that we are using here, namely, the large separation. For this reason, we computed our models with the MESA code, version 15140, (Paxton 2019), and the related oscillations with the FILOU code (Suárez & Goupil 2008), taking rotation into account up to second order in the perturbative theory for the adiabatic oscillation computation (including near-degeneracy effects and stellar structure deformation).
Following Paper I, we built two grids of representative models to characterise δ Sct stars during their stay on the pre-main sequence (PMS) and the MS, one for Trumpler 10 and another for Praesepe. In Table 5 we introduce their main parameters. We used the default nuclear reactions network, basic.net, provided by MESA. At the zero-age main sequence (ZAMS), with X being constant, when Z increases, Y decreases by the same amount, so that X + Y + Z = 1. After testing exponential overshooting values, f0 = 0.002 and f = 0.022, we found no significant impact and thus we did not use any overshooting. We did include internal differential rotation. We computed the models initiating rotation at the ZAMS. The values for the initial angular velocity to critical velocity ratio are between 0.1 Ωc and 0.5 Ωc, avoiding higher values that may lie beyond the limits of the perturbative theory. We computed p modes between n = 1 and the cut-off frequency, the limiting frequency up to which acoustic modes can propagate without damping. We used the modes in the low-order regime, between n = 2 and n = 8, and with degrees between l = 0 and l = 3, to calculate the low-order large separation, as proposed by Suárez et al. (2014).
Parameters of the stellar model grids built with the MESA code.
6. Method for estimating ages
We estimated the seismic age of each cluster following these steps: (1) For each star, we constrained the models using its estimated values of Δνlow and  , taking into account their corresponding uncertainties. (2) We computed the ratios of the observed frequencies to select the frequencies with ratios that match those of the models (Table 6). (3) Once we found a range of radial modes matching the observed frequencies, we used them with the models selected at step 1 to better constrain the stellar ages. (4) After applying steps 1–3 to all stars in the same group, we plotted the age distribution weighted histograms of all the constrained models. (5) We computed the best weighted probability density function (WPDF) over the histogram. For that purpose, we assumed a normal distribution and we use, as initial guesses, the maximum likelihood estimation: the weighted mean of all the ages of the constrained models and its corresponding weighted standard deviation. Finally, for the age of the cluster and its corresponding standard deviation, we took the parameters of the fitted WPDF in a χ2 minimisation process.
Fundamental mode to radial overtone ratios in our MESA/FILOU grids of models, with their corresponding standard deviations.
We computed the weight of each constrained model, p given in Eq. (4), taking into account the following assumptions: (1) Each evolutionary track computed with MESA was oversampled at low ages. To compensate for this effect, our WPDF is kept proportional to the time step, Δt, divided by the total time, t, of the model in its evolutionary track. (2) We also evaluated the probability of the models corresponding to each star in the sample. Models corresponding to stars with better measured Δνlow and  contribute (with a greater probability) the estimated age of the cluster. Then the WPDF is inversely proportional to the relative uncertainties of
  and
and  of each star. (3) Regarding the probability that a model is the age of the whole cluster, we assigned it a weight proportional to the number of stars that are this same age, nstars, divided by the total number of stars in the sample, Nstars. (4) The number of constrained models with the same age, n, divided by the total number of models in the grid, N.
Combining all of the parameters, we obtain:
 (4)
(4)
The formula for χ2 (Eq. (5)) was applied over the densities of the histogram, his(age), in order to obtain the best possible fit to a normal distribution, norm(age):
 (5)
(5)
Figure 4 shows the positions and the ranges of the possible radial overtones in the frequency spectrum of TIC 28943819 (see Appendix C for the rest of our sample). These ranges are too wide in some cases because we sampled the whole grid for identification. Then, the inclusion of the fundamental mode has a minimal impact on the constraints we derive on the models, but it helps confirm what we obtain from the other seismic parameters. The identification has failed estimating the ranges for the possible radial overtones only in the cases with fewer than 30 extracted significant frequencies: TIC 175194881 in Praesepe, as well as TIC 30307085 and TIC 271061334 in Trumpler 10. This is why there are seven figures in Appendix C, instead of 10 (the total number of stars in our sample), plus TIC 28943819.
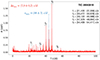 |
Fig. 4. Ranges for the possible radial overtones in the frequency spectrum of TIC 28943819. |
7. Results and discussion
7.1. Trumpler 10
The HRD of Fig. 5 (left panel) shows the ages of the seismically constrained models of our sample of δ Sct stars in Trumpler 10. We can see that they are very close to the ZAMS. Focussing on models between 1.60 and 2.00 M⊙ (Fig. 5, right panel), the constrained models show that TIC 28944596 and TIC 271062192, the least massive stars of the sample, seem to be older than the rest of the sample. It is possible that both stars are actually older or, alternatively, these apparent older ages may have to do with a gravity-darkening effect or a possible binary companion. The observed larger radii, lower densities, and higher luminosities (presented in Table 2) could shed light on the three hypotheses.
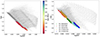 |
Fig. 5. HRDs of the evolutionary tracks of our grid of representative models for the sample of δ Sct stars in Trumpler 10, the ages of the seismically constrained models have been colour coded. Zoom on the interval between 1.60 M⊙ and 2.00 M⊙ is shown on the right, where we distinguish between models for each of the stars in the sample using different colours. |
To determine the mean age of the group, we first computed the age weighted histograms corresponding to every star of the sample from the seismically constrained models (Fig. 6, left panel). We then estimated the mean age of the whole group, as a single population by calculating the best possible distribution on the histograms, using a normal WPDF, as explained in Sect. 6 (Fig. 6). The result is a mean age of around  Myr, very close to the ZAMS. This is a younger age estimate than those referenced in Sect. 2, compatible with estimates from Kharchenko et al. (2013), Netopil et al. (2016), of around 34 Myr and 40 Myr, respectively. Some uncertainties probably emerge because seismic parameters, including the large separation, evolve rapidly for stars on the PMS.
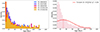 |
Fig. 6. Age-weighted histograms of our sample of stars in Trumpler 10. Left: weighted histogram of each member of the sample. Right: weighted histogram of the whole sample. The red solid line shows the computed PDF with a mean age of |

Recent theoretical works have shown that the PMS is a complex phase. For example, Kunitomo et al. (2017) claimed that the spread in luminosity during the PMS can be explained through different efficiencies at which the accreted material is converted into internal energy for each star. For these very young clusters, it seems that we need other parameters, in addition to the seismic ones we use, to date the stars with greater accuracy. This is confirmed by the findings of Steindl et al. (2022), who reported that different PMS accretion scenarios cause differences in the pulsation modes, thus leaving an imprint on the frequency content of a δ Sct star. The seismology of PMS stars offers a lot of insight into their interior structure.
Compared to the works of Murphy et al. (2021), Steindl et al. (2022), our uncertainties are one order of magnitude larger with the stars of Trumpler 10. Murphy et al. (2021) computed Δνlow = 6.83 ± 0.01 d−1 for the PMS star HD 139614, which is a value that is more precise than our measured large separations by one order of magnitude. By scanning a variety of models for mode identification, we sampled the entire relevant parameter space, which makes uncertainties larger but more realistic. We limit our mode identification precision by avoiding over-reliance on our models.
7.2. Praesepe
Figure 7 shows the HRD of the seismically constrained models for the δ Sct stars group in Praesepe. Two stars, TIC 175264376 and TIC 175291778, clearly appear to be older than the rest of the sample (right panel). This is more evident in Fig. 8 (top left panel), where we plot the age-weighted histogram for every star of the sample. If we consider the sample as a single population, then the computed WPDFs (bottom panel) give us a mean age of 580 ± 230 Myr – and even younger if we compare it to the references cited in Sect. 2 (but in good agreement with them). It is significant to note that our estimate is very near of the age used by Fossati et al. (2008),  Myr, where the authors calculated the metallicity of the cluster from an abundance analysis of A- and F-type stars. Five of them have been used in the present work.
The discrepant large separations and densities of TIC 175264376 and TIC 175291778 can be explained through rotation, different ages, binary systems, or lower confidence in the estimated seismic parameters. First, a rapid rotation may modify the value of the large separation, but not the scaling relation between the large separation and the mean density (García Hernández et al. 2015; Mirouh et al. 2019). Their relatively higher TIC radii and lower TIC densities (Table 3) are in line with the lower low-order large separations and frequencies at maximum power we estimate for both stars (Table 4). The high value of the projected rotation velocity of TIC 175264376 (200 km s−1) is very significant in this sense. Our 1D models cannot be reliably applied to such high rotational velocities. We thus need 2D models to characterise rapidly rotating stars. In a more evolved cluster such as Praesepe, rotation and other internal mixing phenomena can affect the stars differently over time.
Second, these bigger and lower-density stars with masses similar to the others may also simply be more evolved. In Table 3, we can see that these stars, plus TIC 175194881, may be late A or earlier F stars, while the other three may be middle A stars, according to Fossati et al. (2008). These could point to two different populations of stars.
Third, the outlier stars may be in binary systems. Their luminosities would be brighter than models of single stars would suggest, making them appear more evolved.
We can also revisit our one-population assumption, as there could be two populations, whereby the four younger stars would be ‘Pop 1’ and TIC 175264376 and TIC 175291778 would be ‘Pop 2’ (Fig. 8, top right panel). Once the WPDF of both populations were computed, we would obtain a mean age of 510 ± 140 Myr for ‘Pop 1’ and a mean age of 890 ± 140 Myr for ‘Pop 2’. These histograms are quite different from the histogram with a single population, which brings us to a fourth explanation for this apparent bimodality. Compared to ‘Pop 1’ stars, those in ‘Pop 2’ contribute less weight to the WPDF of the totality of the constrained models, due to their larger uncertainties in the measurements of the low-large separation and the seismic effective temperature. Then, assuming one single population, the age of the cluster is closer to the age of ‘Pop 1’ than the age of ‘Pop 2’.
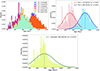 |
Fig. 8. Age-weighted histograms of the seismically constrained models of our sample of stars in Praesepe 10. Top left: weighted histograms for each member of the sample. Top right: weighted histograms for the apparent two δ Sct stars populations: Pop 1 groups, with stars TIC 175194881, TIC 175265807, TIC 184914505 and TIC 184917633; and Pop 2 groups, with stars TIC 175264376 and TIC 175291778. The red solid line is the computed PDF of Pop 1, with a mean age of 510 ± 140 Myr. The blue solid line is the computed PDF of Pop 2, with a mean age of 890 ± 140 Myr. Bottom: weighted histogram of the whole sample, considered as one single population. The green solid line is the computed PDF, with a mean age of 580 ± 230 Myr. |
As we can see in Tables 7 and 8, the models are not well constrained in terms of rotational velocity. Estimating the rotation rate of some stars of the group would yield further constraints on the models, especially given the dependence of the seismic parameters such as the large separation or the frequency ratios on rotation (Suárez et al. 2006).
Constrained parameters of the models corresponding to our selected targets in Trumpler 10, with their corresponding standard deviations.
Murphy et al. (2022) used a grid of non-rotating stars to model the three slowest rotators from the Pleiades sample to verify their mode identification. However, they did not model the other two stars, namely: rapid rotators V1228 Tau (v sin i = 200 km s−1) and V650 Tau (v sin i = 230 km s−1), for which the échelle diagrams are more ambiguous. They also concluded that rotating models are required for a more accurate inference of the asteroseismic parameters, including the mode identification. A high rotation mixes the modes in such a way that it is not easy to identify them within such a complex spectrum. In this analysis, and that of Paper I, we included rotating models and defined a strategy that would serve as a stepping stone towards a complete mode identification in rapid rotators. Then, to advance this strategy, we would need a method to help us confidently interpret the rotation frequency in the dense frequency spectrum of δ Sct stars. It is also crucial to obtain a more reliable mode identification, through longer exposure observations that would allow a higher resolution in the frequency spectrum. We hope that future missions, such as the ESA projects PLAnetary Transits and Oscillations of stars4 (PLATO, Rauer et al. 2014) and High-precision AsteroseismologY in DeNse stellar fields5 (HAYDN, Miglio et al. 2021), will provide higher resolution photometry for stars belonging to clusters, leading to more accurate age estimates.
8. Conclusions
The use of asteroseismology to date young open clusters provides promising results, despite the limitations of statistical techniques applied to samples with such small numbers of stars. We tested a seismic method with three open clusters of different ages. With α Per, we obtained the first results in Pamos Ortega et al. (2022). In the present work, we extend the research to Trumpler 10 and Praesepe and we estimate the ranges with the possible values of some radial overtones and the fundamental mode.
Regarding Trumpler 10, we find five δ Sct star candidates that have never before been classified as such, with a mean age of  Myr. The uncertainty is large due to how close they are to the PMS, where stars evolve rapidly. Other parameters are needed to better constrain the models near the ZAMS and to more accurately date the stars.
Regarding Praesepe, we find a new possible δ Scuti star, TIC 184917633, which we added to our sample of five previously known δ Sct stars. We estimate the mean age of this star group to 580 ± 230 Myr, in good agreement with the literature. Two of the six stars in the sample seem to be older than the rest. The different values in their parameters, especially the spectral type, support the thesis of two stellar populations: one with a mean age of 510 ± 140 Myr and another with a mean age of 890 ± 140 Myr. This apparent bimodality in the age distribution could also be due to the effects of gravity-darkening in rapidly-rotating stars. The lower values in the low-order large separation and the frequency at maximum power, in addition to the measured large projected rotation velocity of both stars, support this idea. The 1D models that we have used in this work are not the most suitable to stars with such high rotation rates. Two-dimensional models are needed in order to take more into account the deformation that occurs in them, which would greatly impact the seismic parameters, such as the large separation and a reliable determination of the rotation frequency. Finally, we cannot rule out the possibility of an unreliable estimate for the seismic parameters of the outlier stars. A greater weight of the other four stars in the WPDF corrects for this apparent bimodality.
Acknowledgments
We appreciate the comments and questions from the anonymous referee, because they have contributed to improving the paper. D.P.O. and A.G.H. acknowledge funding support from ‘FEDER/junta de Andalucía-Consejería de Economía y Conocimiento’ under project E-FQM-041-UGR18 by Universidad de Granada. J.C.S., G.M.M. and S.B.F. acknowledge funding support from the Spanish State Research Agency (AEI) project PID2019-107061GB-064. This paper includes data collected with the TESS mission, obtained from the TASC data archive. Funding for the TESS mission is provided by the NASA Explorer Program. STScI is operated by the Association of Universities for Research in Astronomy, Inc., under NASA contract NAS 5-26555.
References
- Angus, R., Price-Whelan, A. M., Zinn, J. C., et al. 2022, AJ, 164, 25 [NASA ADS] [CrossRef] [Google Scholar]
- Barceló Forteza, S., Roca Cortés, T., & García, R. A. 2018, A&A, 614, A46 [NASA ADS] [CrossRef] [EDP Sciences] [Google Scholar]
- Barceló Forteza, S., Moya, A., Barrado, D., et al. 2020, A&A, 638, A59 [NASA ADS] [CrossRef] [EDP Sciences] [Google Scholar]
- Barnes, S. A. 2003, ApJ, 586, 464 [Google Scholar]
- Basri, G., & Martín, E. L. 1999, ApJ, 510, 266 [NASA ADS] [CrossRef] [Google Scholar]
- Bastian, N., & Lardo, C. 2018, ARA&A, 56, 83 [Google Scholar]
- Bedding, T. R., Murphy, S. J., Hey, D. R., et al. 2020, Nature, 581, 147 [NASA ADS] [CrossRef] [Google Scholar]
- Bedding, T. R., Murphy, S. J., Crawford, C., et al. 2023, ApJ, 946, L10 [NASA ADS] [CrossRef] [Google Scholar]
- Bochanski, J. J., Faherty, J. K., Gagné, J., et al. 2018, AJ, 155, 149 [NASA ADS] [CrossRef] [Google Scholar]
- Bowman, D. M., & Kurtz, D. W. 2018, MNRAS, 476, 3169 [NASA ADS] [CrossRef] [Google Scholar]
- Brandt, T. D., & Huang, C. X. 2015, ApJ, 807, 24 [NASA ADS] [CrossRef] [Google Scholar]
- Breger, M., Stich, J., Garrido, R., et al. 1993, A&A, 271, 482 [NASA ADS] [Google Scholar]
- Cantat-Gaudin, T., Jordi, C., Vallenari, A., et al. 2018, A&A, 618, A93 [NASA ADS] [CrossRef] [EDP Sciences] [Google Scholar]
- Choi, J., Dotter, A., Conroy, C., et al. 2016, ApJ, 823, 102 [Google Scholar]
- Costa, G., Girardi, L., Bressan, A., et al. 2019, A&A, 631, A128 [NASA ADS] [CrossRef] [EDP Sciences] [Google Scholar]
- Cummings, J. D., Deliyannis, C. P., Maderak, R. M., & Steinhauer, A. 2017, AJ, 153, 128 [Google Scholar]
- Cummings, J. D., Kalirai, J. S., Tremblay, P. E., Ramirez-Ruiz, E., & Choi, J. 2018, ApJ, 866, 21 [NASA ADS] [CrossRef] [Google Scholar]
- da Silva, R., Porto de Mello, G. F., Milone, A. C., et al. 2012, A&A, 542, A84 [NASA ADS] [CrossRef] [EDP Sciences] [Google Scholar]
- Dias, W. S., Monteiro, H., Moitinho, A., et al. 2021, MNRAS, 504, 356 [NASA ADS] [CrossRef] [Google Scholar]
- Douglas, S. T., Curtis, J. L., Agüeros, M. A., et al. 2019, ApJ, 879, 100 [Google Scholar]
- Fossati, L., Bagnulo, S., Landstreet, J., et al. 2008, A&A, 483, 891 [NASA ADS] [CrossRef] [EDP Sciences] [Google Scholar]
- Gaia Collaboration (Babusiaux, C., et al.) 2018, A&A, 616, A10 [NASA ADS] [CrossRef] [EDP Sciences] [Google Scholar]
- García Hernández, A., Moya, A., Michel, E., et al. 2009, A&A, 506, 79 [NASA ADS] [CrossRef] [EDP Sciences] [Google Scholar]
- García Hernández, A., Moya, A., Michel, E., et al. 2013, A&A, 559, A63 [NASA ADS] [CrossRef] [EDP Sciences] [Google Scholar]
- García Hernández, A., Martín-Ruiz, S., Monteiro, M. J. P. F. G., et al. 2015, ApJ, 811, L29 [Google Scholar]
- García Hernández, A., Suárez, J. C., Moya, A., et al. 2017, MNRAS, 471, L140 [CrossRef] [Google Scholar]
- Grigahcène, A., Antoci, V., Balona, L., et al. 2010, ApJ, 713, L192 [Google Scholar]
- Hasanzadeh, A., Safari, H., & Ghasemi, H. 2021, MNRAS, 505, 1476 [NASA ADS] [CrossRef] [Google Scholar]
- Hey, D., & Ball, W. 2020, https://doi.org/10.5281/zenodo.3629933 [Google Scholar]
- Kharchenko, N. V., Piskunov, A. E., Schilbach, E., Röser, S., & Scholz, R. D. 2013, A&A, 558, A53 [NASA ADS] [CrossRef] [EDP Sciences] [Google Scholar]
- Krause, M. G. H., Offner, S. S. R., Charbonnel, C., et al. 2020, Space Sci. Rev., 216 [CrossRef] [Google Scholar]
- Kunitomo, M., Guillot, T., Takeuchi, T., & Ida, S. 2017, A&A, 599, A49 [NASA ADS] [CrossRef] [EDP Sciences] [Google Scholar]
- Martín, E. L., Dahm, S., & Pavlenko, Y. 2001, ASP Conf. Ser., 245, 349 [Google Scholar]
- Meibom, S., & Mathieu, R. D. 2005, ApJ, 620, 970 [Google Scholar]
- Messina, S., Nardiello, D., Desidera, S., et al. 2022, A&A, 657, L3 [NASA ADS] [CrossRef] [EDP Sciences] [Google Scholar]
- Miglio, A., Girardi, L., Grundahl, F., et al. 2021, Exp. Astron., 51, 963 [NASA ADS] [CrossRef] [Google Scholar]
- Mirouh, G. M., Angelou, G. C., Reese, D. R., & Costa, G. 2019, MNRAS, 483, L28 [NASA ADS] [CrossRef] [Google Scholar]
- Moya, A., Sarro, L. M., Delgado-Mena, E., et al. 2022, A&A, 660, A15 [NASA ADS] [CrossRef] [EDP Sciences] [Google Scholar]
- Murphy, S. J., Joyce, M., Bedding, T. R., White, T. R., & Kama, M. 2021, MNRAS, 502, 1633 [NASA ADS] [CrossRef] [Google Scholar]
- Murphy, S. J., Bedding, T. R., White, T. R., et al. 2022, MNRAS, 511, 5718 [NASA ADS] [CrossRef] [Google Scholar]
- Netopil, M., Paunzen, E., Heiter, U., & Soubiran, C. 2016, A&A, 585, A150 [NASA ADS] [CrossRef] [EDP Sciences] [Google Scholar]
- Pamos Ortega, D., García Hernández, A., Suárez, J. C., et al. 2022, MNRAS, 513, 374 [NASA ADS] [CrossRef] [Google Scholar]
- Paparó, M., Benkő, J. M., Hareter, M., & Guzik, J. A. 2016, ApJ, 822, 100 [CrossRef] [Google Scholar]
- Paxton, B. 2019, ApJS, 243, A10 [NASA ADS] [CrossRef] [Google Scholar]
- Press, W. H., & Rybicki, G. B. 1989, ApJ, 338, 277 [Google Scholar]
- Ramón-Ballesta, A., García Hernández, A., Suárez, J. C., et al. 2021, MNRAS, 505, 6217 [CrossRef] [Google Scholar]
- Rauer, H., Catala, C., Aerts, C., et al. 2014, Exp. Astron., 38, 249 [Google Scholar]
- Reese, D. R., Lignières, F., Ballot, J., et al. 2017, A&A, 601, A130 [NASA ADS] [CrossRef] [EDP Sciences] [Google Scholar]
- Ricker, G. R., Winn, J. N., Vanderspek, R., et al. 2014, Proc. SPIE, 9143, 914320 [Google Scholar]
- Skiff, B. A. 2014, VizieR Online Data Catalog: B/mk [Google Scholar]
- Spina, L., Meléndez, J., Karakas, A. I., et al. 2017, MNRAS, 474, 2580 [NASA ADS] [Google Scholar]
- Stassun, K. G. 2019, VizieR Online Data Catalog: IV/38 [Google Scholar]
- Stauffer, J. R., Barrado y Navascués, D., Bouvier, J., et al. 1999, ApJ, 527, 219 [NASA ADS] [CrossRef] [Google Scholar]
- Steindl, T., Zwintz, K., & Vorobyov, E. 2022, Nat. Commun., 13, 5355 [NASA ADS] [CrossRef] [Google Scholar]
- Suárez, J. C., & Goupil, M. J. 2008, Ap&SS, 316, 155 [CrossRef] [Google Scholar]
- Suárez, J. C., Michel, E., Pérez Hernández, F., et al. 2002, A&A, 390, 523 [NASA ADS] [CrossRef] [EDP Sciences] [Google Scholar]
- Suárez, J. C., Garrido, R., & Goupil, M. J. 2006, A&A, 447, 649 [NASA ADS] [CrossRef] [EDP Sciences] [Google Scholar]
- Suárez, J. C., García Hernández, A., Moya, A., et al. 2014, A&A, 563, A7 [NASA ADS] [CrossRef] [EDP Sciences] [Google Scholar]
- Uytterhoeven, K., Moya, A., Grigahcène, A., et al. 2011, A&A, 534, A125 [CrossRef] [EDP Sciences] [Google Scholar]
- Zhong, J., Chen, L., Wu, D., et al. 2020, A&A, 640, A127 [NASA ADS] [CrossRef] [EDP Sciences] [Google Scholar]
Appendix A: Ten modes with highest extracted amplitudes and associated frequencies for each star in our δ Sct star sample
Ten highest-amplitude modes and their frequencies for each star in our samples of Trumpler 10 and Praesepe. The tables correspond to each star in our sample, with all the extracted frequencies, and are available online at CDS.
Appendix B: Estimated large separations of our δ Sct star sample
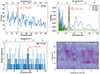 |
Fig. B.10. Same as Fig. 3 for TIC 184917633. |
Appendix C: Positions and ranges of the possible radial modes of our δ Sct star sample
All Tables
Ages and metallicities for Trumpler 10 and Praesepe from some of the main references of the last twenty years and used in this work.
Seismic indices of the selected targets from Trumpler 10 and Praesepe: the low-order large separation, frequency at maximum power, and its corresponding seismic and TIC effective temperature.
Fundamental mode to radial overtone ratios in our MESA/FILOU grids of models, with their corresponding standard deviations.
Constrained parameters of the models corresponding to our selected targets in Trumpler 10, with their corresponding standard deviations.
Ten highest-amplitude modes and their frequencies for each star in our samples of Trumpler 10 and Praesepe. The tables correspond to each star in our sample, with all the extracted frequencies, and are available online at CDS.
All Figures
|
Fig. 1. Frequency spectrum of the sample of δ Sct stars candidates in the field of Trumpler 10. The red dotted line is the significance threshold, S/N = 4. |
| In the text | |
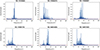 |
Fig. 2. Same as Fig. 1 for the Praesepe sample. |
| In the text | |
|
Fig. 3. Estimated low-order large separation for TIC 28943819, using the autocorrelation diagram (top-left), the discrete Fourier transform (top-right), the frequency difference histogram (bottom-left), and the échelle diagram (Hey & Ball 2020, bottom-right). |
| In the text | |
|
Fig. 4. Ranges for the possible radial overtones in the frequency spectrum of TIC 28943819. |
| In the text | |
|
Fig. 5. HRDs of the evolutionary tracks of our grid of representative models for the sample of δ Sct stars in Trumpler 10, the ages of the seismically constrained models have been colour coded. Zoom on the interval between 1.60 M⊙ and 2.00 M⊙ is shown on the right, where we distinguish between models for each of the stars in the sample using different colours. |
| In the text | |
|
Fig. 6. Age-weighted histograms of our sample of stars in Trumpler 10. Left: weighted histogram of each member of the sample. Right: weighted histogram of the whole sample. The red solid line shows the computed PDF with a mean age of |
| In the text | |
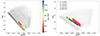 |
Fig. 7. Same as Fig. 5 for Praesepe. |
| In the text | |
|
Fig. 8. Age-weighted histograms of the seismically constrained models of our sample of stars in Praesepe 10. Top left: weighted histograms for each member of the sample. Top right: weighted histograms for the apparent two δ Sct stars populations: Pop 1 groups, with stars TIC 175194881, TIC 175265807, TIC 184914505 and TIC 184917633; and Pop 2 groups, with stars TIC 175264376 and TIC 175291778. The red solid line is the computed PDF of Pop 1, with a mean age of 510 ± 140 Myr. The blue solid line is the computed PDF of Pop 2, with a mean age of 890 ± 140 Myr. Bottom: weighted histogram of the whole sample, considered as one single population. The green solid line is the computed PDF, with a mean age of 580 ± 230 Myr. |
| In the text | |
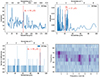 |
Fig. B.1. Same as Fig. 3 for TIC 30307085. |
| In the text | |
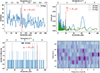 |
Fig. B.2. Same as Fig. 3 for TIC 28944596. |
| In the text | |
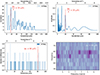 |
Fig. B.3. Same as Fig. 3 for TIC 271061334. |
| In the text | |
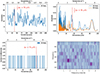 |
Fig. B.4. Same as Fig. 3 for TIC 271062192. |
| In the text | |
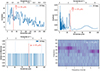 |
Fig. B.5. Same as Fig. 3 for TIC 175194881. |
| In the text | |
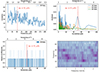 |
Fig. B.6. Same as Fig. 3 for TIC 175264376. |
| In the text | |
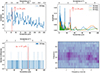 |
Fig. B.7. Same as Fig. 3 for TIC 175265807. |
| In the text | |
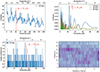 |
Fig. B.8. Same as Fig. 3 for TIC 175291778. |
| In the text | |
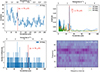 |
Fig. B.9. Same as Fig. 3 for TIC 184914505. |
| In the text | |
|
Fig. B.10. Same as Fig. 3 for TIC 184917633. |
| In the text | |
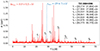 |
Fig. C.1. Same as Fig. 4 for TIC 28944596. |
| In the text | |
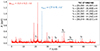 |
Fig. C.2. Same as Fig. 4 for TIC 271062192. |
| In the text | |
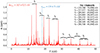 |
Fig. C.3. Same as Fig. 4 for TIC 175264376. |
| In the text | |
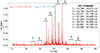 |
Fig. C.4. Same as Fig. 4 for TIC 175265807. |
| In the text | |
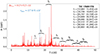 |
Fig. C.5. Same as Fig. 4 for TIC 175291778. |
| In the text | |
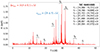 |
Fig. C.6. Same as Fig. 4 for TIC 184914505. |
| In the text | |
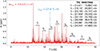 |
Fig. C.7. Same as Fig. 4 for TIC 184917633. |
| In the text | |
Current usage metrics show cumulative count of Article Views (full-text article views including HTML views, PDF and ePub downloads, according to the available data) and Abstracts Views on Vision4Press platform.
Data correspond to usage on the plateform after 2015. The current usage metrics is available 48-96 hours after online publication and is updated daily on week days.
Initial download of the metrics may take a while.