Free Access
Fig. 4.
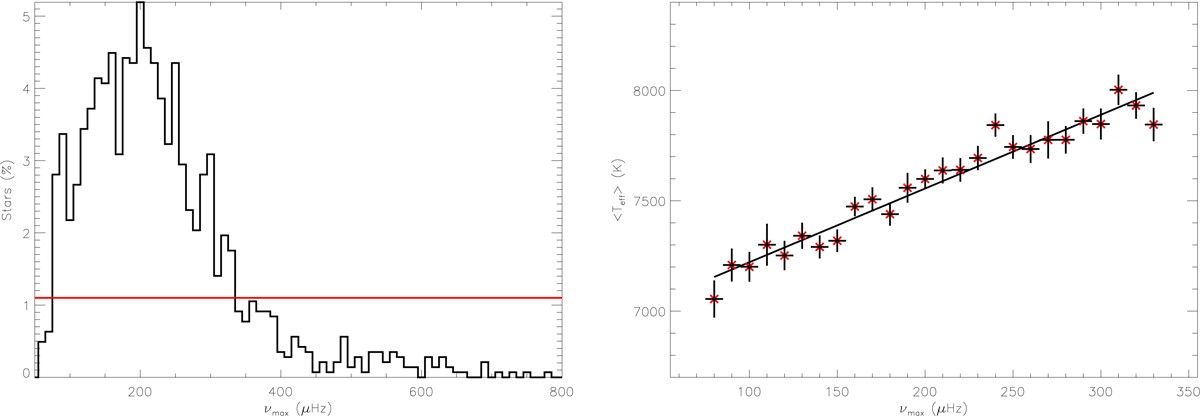
Left panel: population of stars for each 10 μHz bin of νmax. The red solid line indicates the threshold we used to calculate the MFIT (see text). Right panel: scaling relation found using MFIT.
Current usage metrics show cumulative count of Article Views (full-text article views including HTML views, PDF and ePub downloads, according to the available data) and Abstracts Views on Vision4Press platform.
Data correspond to usage on the plateform after 2015. The current usage metrics is available 48-96 hours after online publication and is updated daily on week days.
Initial download of the metrics may take a while.