Fig. 3.
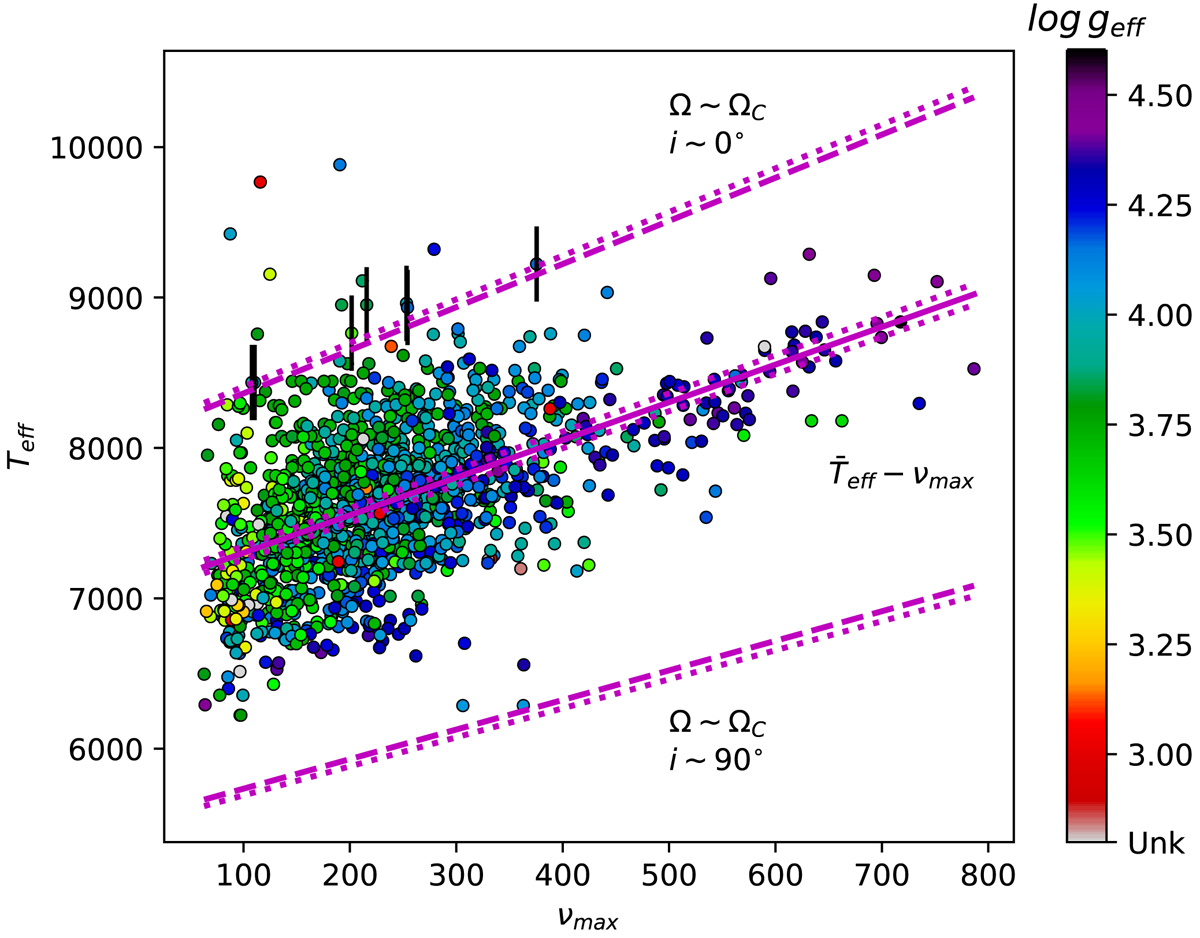
Relation between νmax and ![]() for δ Scuti stars (solid line) using LFIT (see text). The colour of each star indicates its measured geff (Unk is for unknown value). Dashed lines mark the limits of the predicted dispersion due to the gravity-darkening effect. All dotted lines represent the estimated error of the linear fit. We show only the error bars for stars in the limit for clarity.
for δ Scuti stars (solid line) using LFIT (see text). The colour of each star indicates its measured geff (Unk is for unknown value). Dashed lines mark the limits of the predicted dispersion due to the gravity-darkening effect. All dotted lines represent the estimated error of the linear fit. We show only the error bars for stars in the limit for clarity.
Current usage metrics show cumulative count of Article Views (full-text article views including HTML views, PDF and ePub downloads, according to the available data) and Abstracts Views on Vision4Press platform.
Data correspond to usage on the plateform after 2015. The current usage metrics is available 48-96 hours after online publication and is updated daily on week days.
Initial download of the metrics may take a while.