Free Access
Fig. 2.
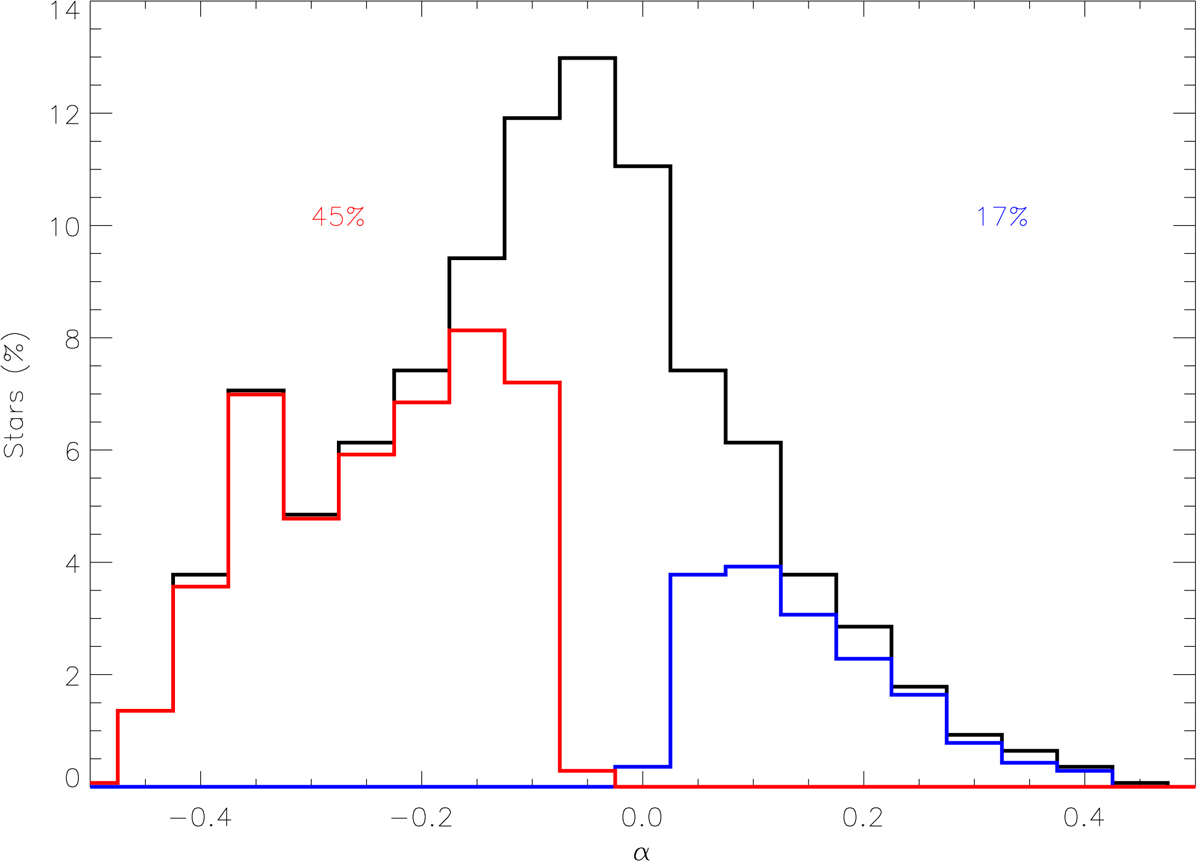
Distribution of stars according to their asymmetry (black histogram). Blue (red) histogram denotes the proportion of stars whose νmax deviation from the mean frequency of the envelope towards lower (higher) frequencies is significantly higher than the solar case (see text).
Current usage metrics show cumulative count of Article Views (full-text article views including HTML views, PDF and ePub downloads, according to the available data) and Abstracts Views on Vision4Press platform.
Data correspond to usage on the plateform after 2015. The current usage metrics is available 48-96 hours after online publication and is updated daily on week days.
Initial download of the metrics may take a while.